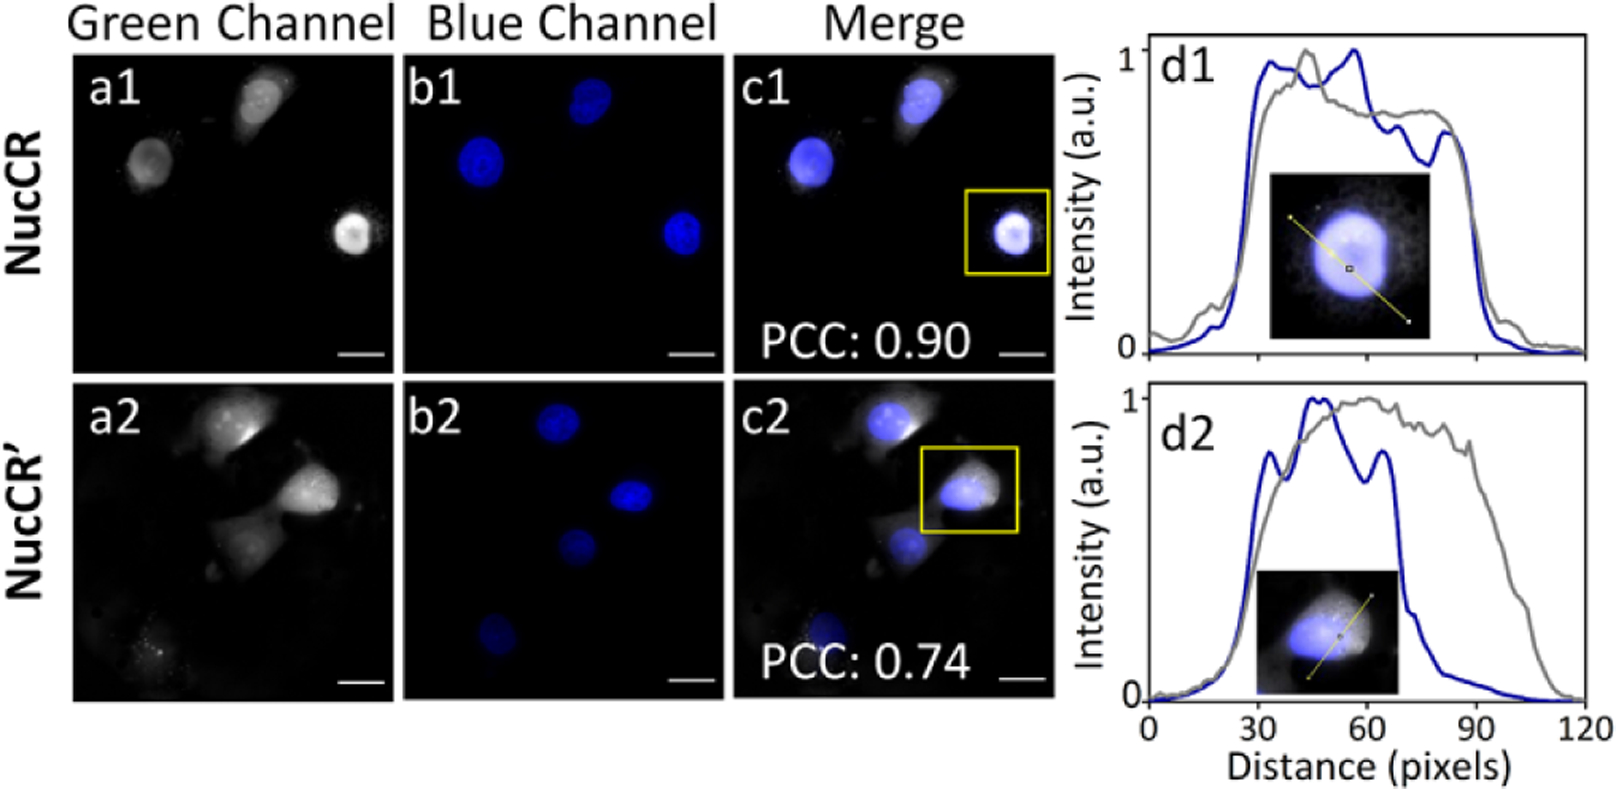
Figure 1.

Fluorescence images of live MCF-7 cells incubated with 10 μM NucCR (a1-c1) or NucCR’ (a2-c2) for 2 h, and 3 μM Hoechst 33342 for an additional 15 min. Cross-sectional analysis (d1) and (d2) along the yellow line in the insets (amplified images of a single cell inside the yellow squares in c1 and c2 images, respectively). Green fluorescence channel shows location of NucCR or NucCR’ (shown as grey color for clarity, ex. 450/90 nm, em. 500/50 nm); Blue channel shows location of Hoechst 33342 (ex. 387/11 nm, em. 447/60 nm). Scale bar = 20 μm.
