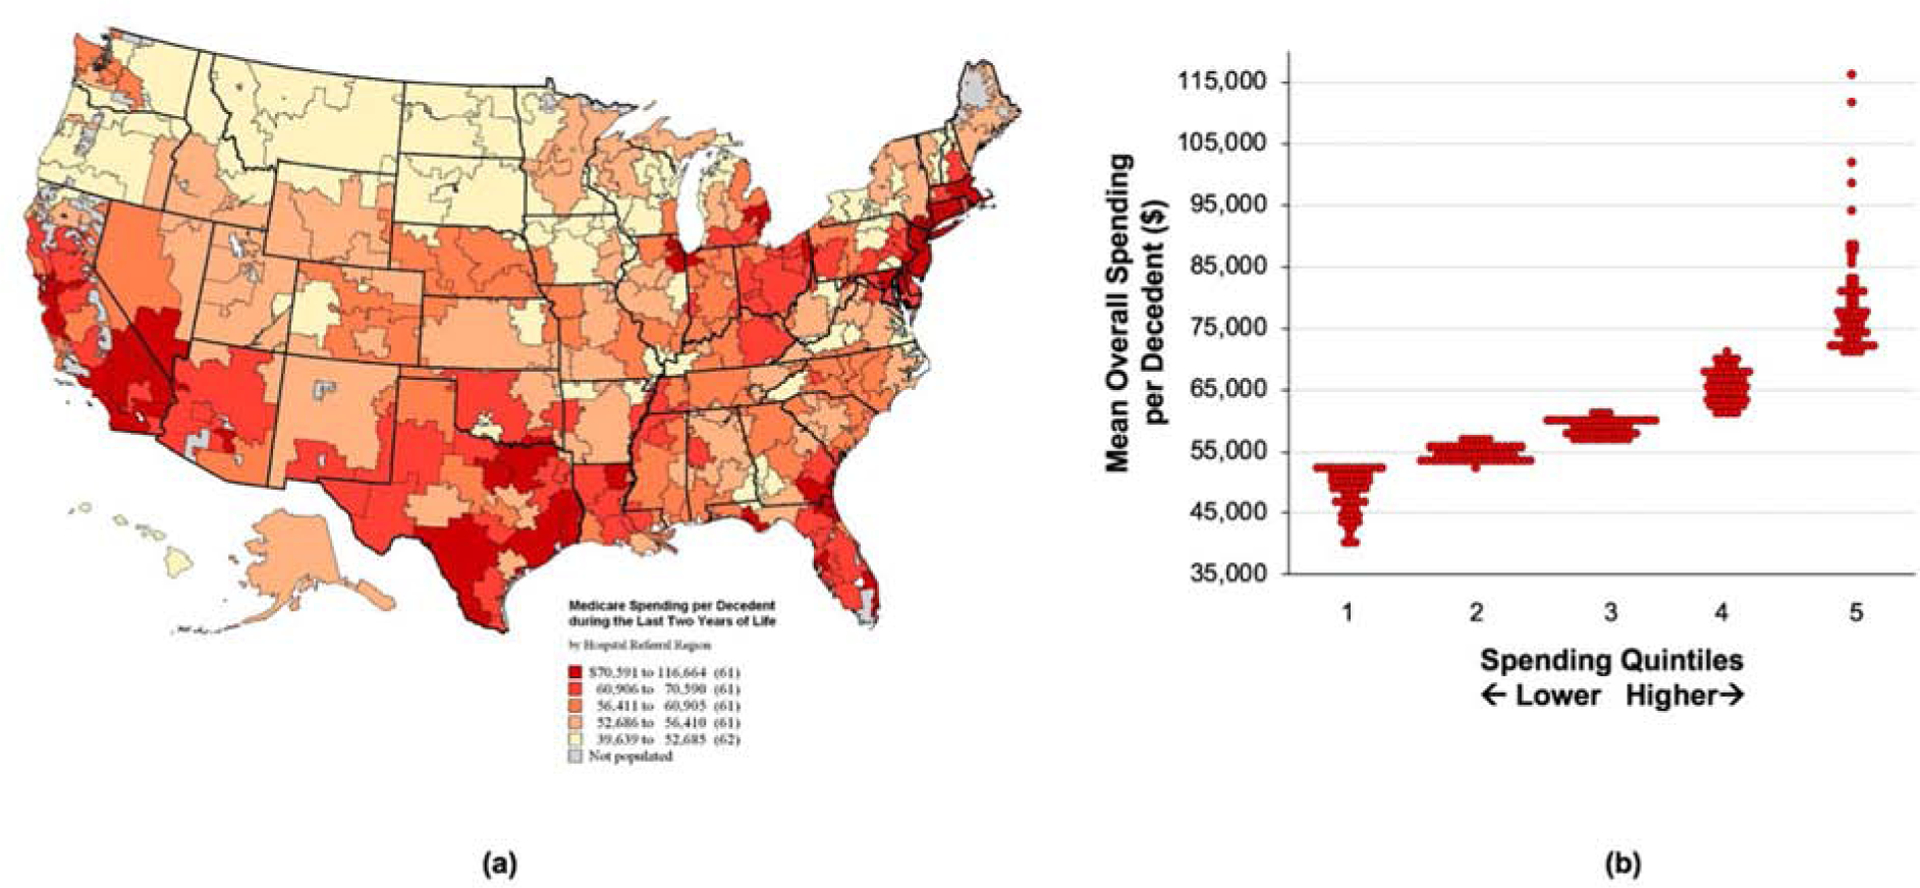
Figure 1. Variation in Overall Medicare Spending Among Older Adults with COPD During the Last Two Years of Life.

(a) This map illustrates geographic variation across the US in Medicare spending per decedent during the last two years of life. HRRs are color-coded across quintiles of increasing spending. (b) This turnip plot demonstrates the distribution in mean overall spending per decedent within and across spending quintiles.
