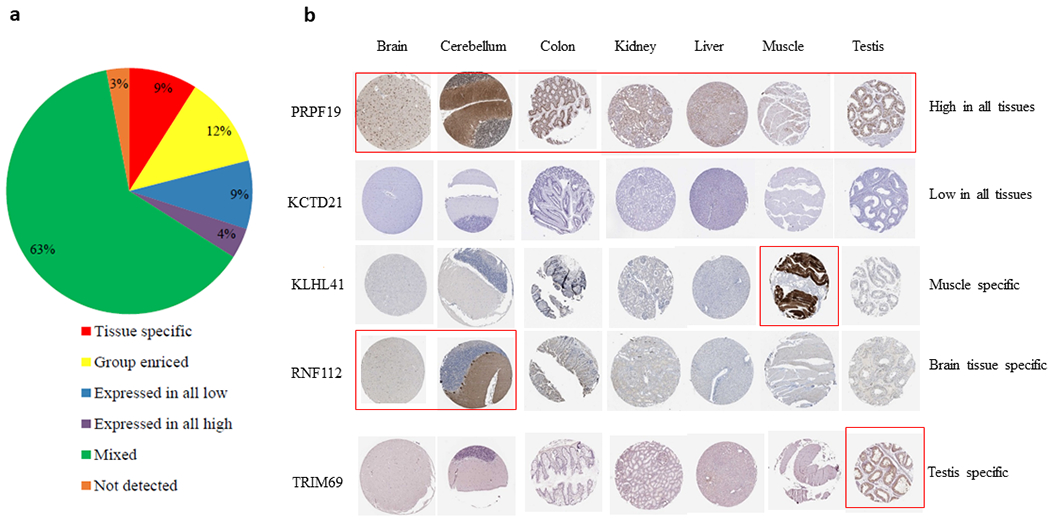
Fig. 4. Distribution of E3 ligases in normal tissues.

a, Percentage of E3 ligases in normal tissues according to the classification criteria shown in Table 3. b, Immunohistochemistry (IHC) staining of representative E3 ligases in 7 normal tissues. The figures were acquired from the Human Protein Atlas (THPA) (https://www.proteinatlas.org). Red rectangle indicates high expression of E3 ligases in the tissues.
