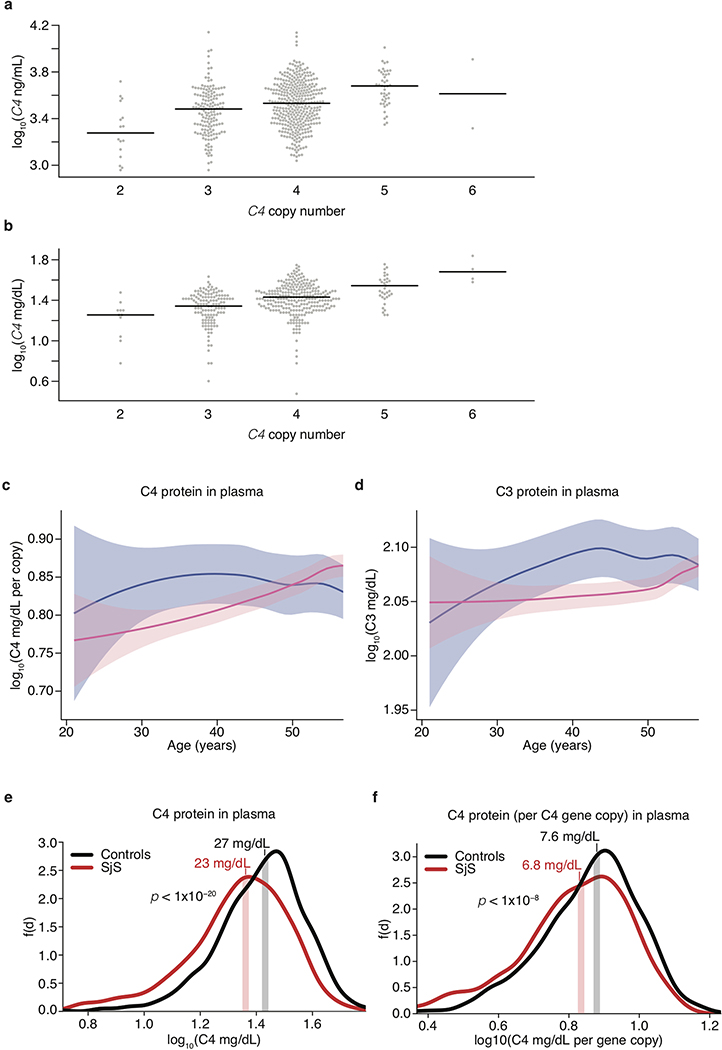
Extended Data Figure 7. Correlation of C4 protein measurements in cerebrospinal fluid and blood plasma with imputed C4 gene copy number and relationship of plasma complement to sex and SjS status.
(a) Measurements of C4 protein in CSF obtained by ELISA are presented as log10(ng/mL) (y-axis) for each observed or imputed copy number of total C4 (x-axis, here showing most likely copy number from imputation). Because C4 gene copy number affects C4 protein levels so strongly, we normalized C4 protein measurements to each donor’s C4 gene copy number in subsequent analyses (Fig. 3c). Bars indicate median values for each C4 copy number.
(b) Measurements of C4 protein in blood plasma obtained by immunoturbidimetric assays are presented as log10(mg/dL) (y-axis) for each imputed most-likely copy number of C4 genes (x-axis). Because C4 gene copy number affects C4 protein levels so strongly, we normalized C4 protein measurements by C4 gene copy number in subsequent analyses as in c. Due to the number of observations (n = 1,844 total), the plot is downsampled to 500 points; the median bars shown are for all individuals (before downsampling).
(c) Levels of C4 protein in blood plasma from 182 adult men and 1662 adult women as a function of age. Concentrations are normalized to the number of C4 gene copies in an individual’s genome (a strong independent source of variance) and shown on a log10 scale as a LOESS curve. Shaded regions represent 95% confidence intervals derived during LOESS.
(d) Levels of C3 protein in blood plasma as a function of age from the same individuals in panel c. Concentrations are shown on a log10 scale as a LOESS curve. Shaded regions represent 95% confidence intervals derived during LOESS.
(e) C4 protein in blood plasma was measured in 670 individuals with SjS (red) and 1,151 individuals without SjS (black) and is shown on a log10 scale (x-axis). Vertical stripes represent median levels for cases and controls separately. Comparison of the two sets was done with a non-parametric two-sided Mann-Whitney rank–sum test (p = 4.8×10⁻²¹).
(f) As in e, but concentrations are normalized to the number of C4 gene copies in an individual’s genome and this per-copy amount is shown on a log10 scale (x-axis). Comparison of the two sets was done with a non-parametric two-sided Mann-Whitney rank–sum test (p = 7.6×10⁻⁹).

