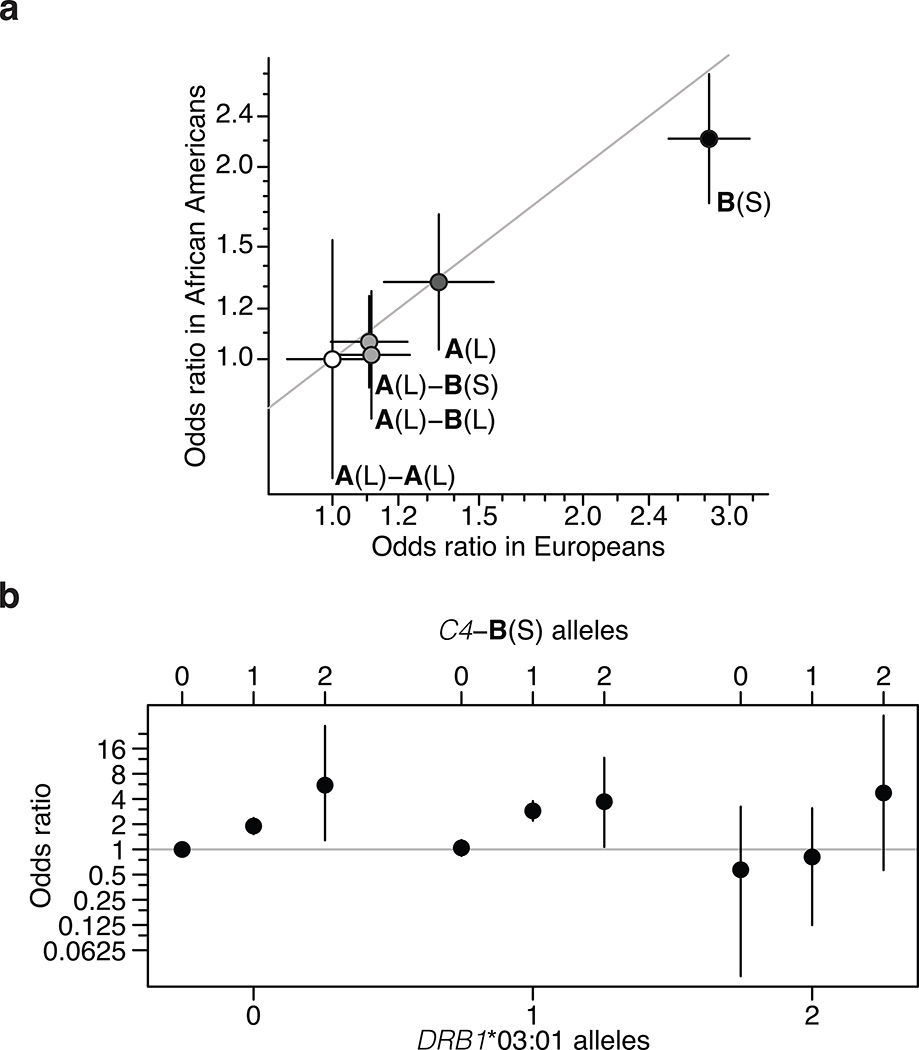
Figure 2. C4 and trans-ancestral analysis of the MHC association signal in SLE.
(a) Common C4 alleles exhibit similar strengths of association (odds ratios) in European-ancestry and African American (1,494 SLE cases; 5,908 controls) cohorts. Error bars represent 95% confidence intervals around the effect size estimate for each sex.
(b) Analysis of SLE risk across combinations of C4-B(S) and DRB1*03:01 genotypes in an African American SLE case–control cohort, in which the two alleles exhibit very little LD (r2 = 0.10). On each DRB1*03:01 genotype background, additional C4-B(S) alleles increase risk (i.e. within each grouping). Whereas on each C4-B(S) background, DRB1*03:01 alleles have no appreciable relationship with risk (this can be seen by comparing, for example, the first of the three points from each group). Error bars represent 95% confidence intervals around the effect size estimate for each combination of C4-B(S) and DRB1*03:01.

