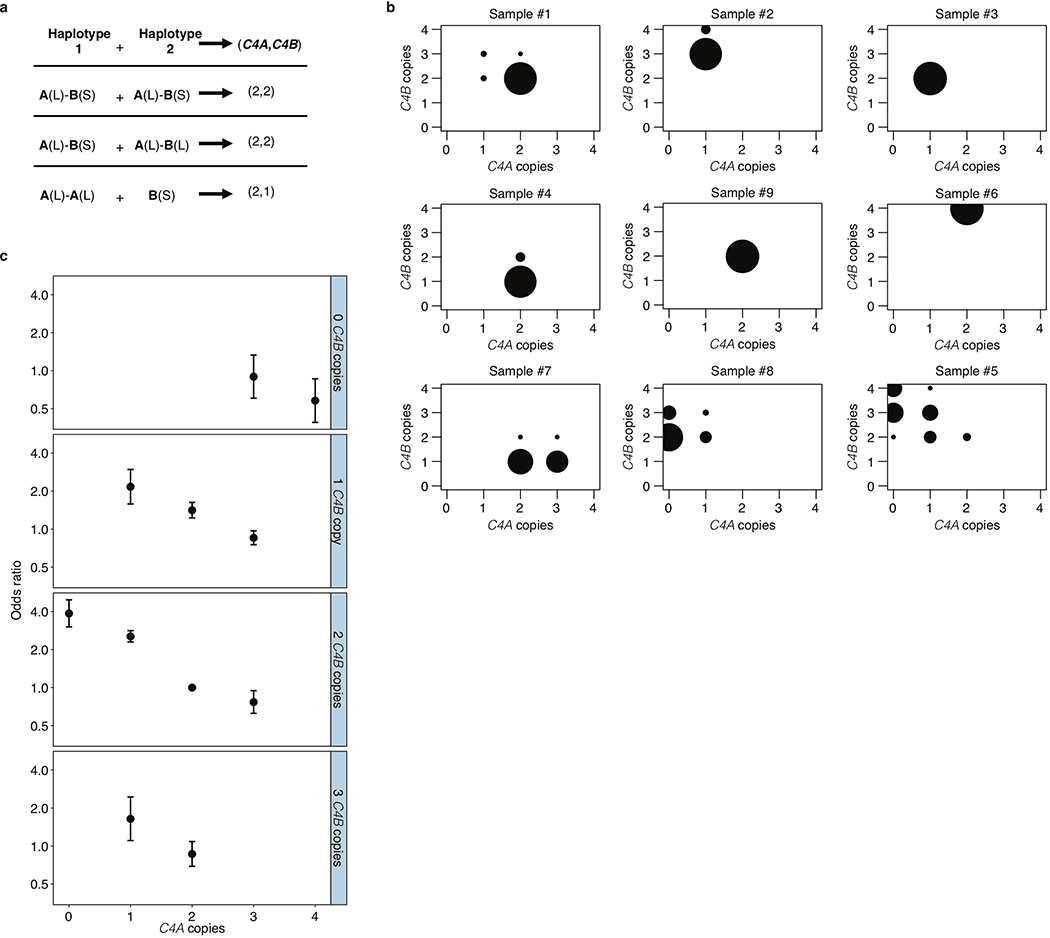
Extended Data Figure 2. Aggregation of joint C4A and C4B genotype probabilities per individual across imputed C4 structural alleles for estimation of SLE risk for each combination.
(a) An individual’s joint C4A and C4B gene copy number can be calculated by summing the C4A and C4B gene contents for each possible pair of two inherited alleles. Many pairings of possible inherited alleles result in the same joint C4A and C4B gene copy number.
(b) Each individual’s C4A and C4B gene copy number was imputed from their SNP data, using the reference haplotypes summarized in Extended Data Fig. 1c. For >95% of individuals (exemplified by samples 1–6 in the figure), this inference can be made with >90% certainty/confidence (the areas of the circles represent the posterior probability distribution over possible C4A/C4B gene copy numbers). For the remaining individuals (exemplified by samples 7–9 in the figure), greater statistical uncertainty persists about C4 genotype. To account for this uncertainty, in downstream association analysis, all C4 genotype assignments are handled as probabilistic gene dosages – analogous to the genotype dosages that are routinely used in large-scale genetic association studies that use imputation.
(c) Odds ratios and 95% confidence intervals underlying each of the C4-genotype risk estimates in Fig. 1a presented as a series of panels for each observed copy number of C4B, with increasing copy number of C4A for that C4B dosage (x-axis). Data are from analysis of 6,748 SLE cases and 11,516 controls of European ancestry.

