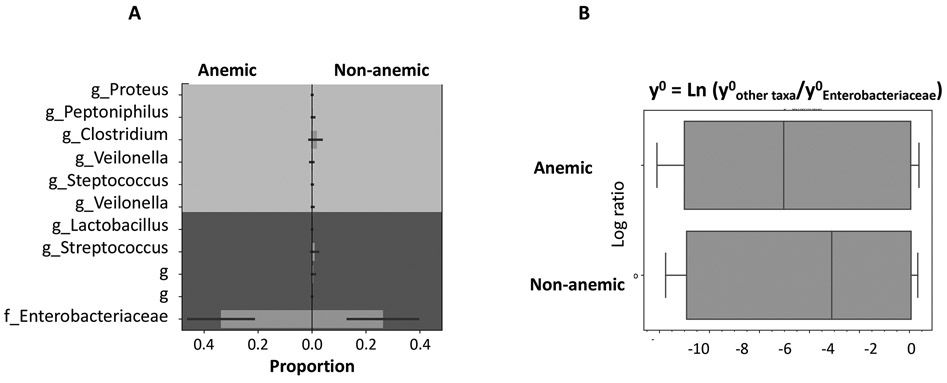
Figure 2: Bacterial balance of Enterobacteriaceae in relative to important genera between anemic and non-anemic groups.
A) Proportion diagram from the balance tree analysis shows higher proportion of Enterobacteriaceae (the major family in Proteobacteria phylum) and lower proportion of Clostridium in anemic group. B) Boxplots represent the accumulative natural log transformation of the ratios of major bacterial genera and Enterobacteriaceae; the smaller log values in anemic group represent higher Enterobacteriaceae counts in relative to the counts of other taxa.

