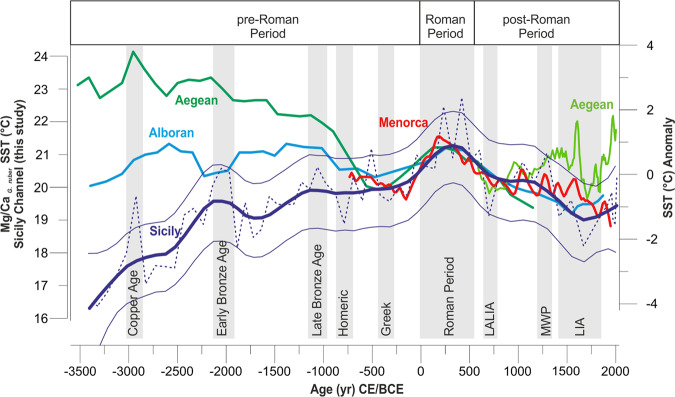
Figure 3.
Comparison of the SSTs records from Sicily Channel (thick dark blue line, Mg/Ca G. ruber core SW104-ND11, this work), Alboran Sea39 (thick light blue line), Minorca Basin16 (thick red line) and Aegean Sea40,41 (thick dark and light green lines) expressed as SST anomalies in relation with the reference period from 750 BCE to 1250 CE (the only period shared by all the records) in order to better compare the amplitude of the changes across the Mediterranean. The Sicily Channel SST raw data (dark blue dashed line, this work) are superimposed on the 95% CI smoothed curve computed as the 2.5% (dark blue thin line) and 97.5% (dark blue thin line) quantile of the 10000 smoothed values (see Material and Methods paragraph). The SST (°C) graduated scale is referred only to the Sicily Channel SST raw data. The Alboran Sea (thick light blue line), Minorca Basin (thick red line) and Aegean Sea (thick dark and light green lines) SST records are represented as 3 points running average. The grey bands show the main climate events documented in the Mediterranean basin and discussed in the text (e.g. Roman Period62).

