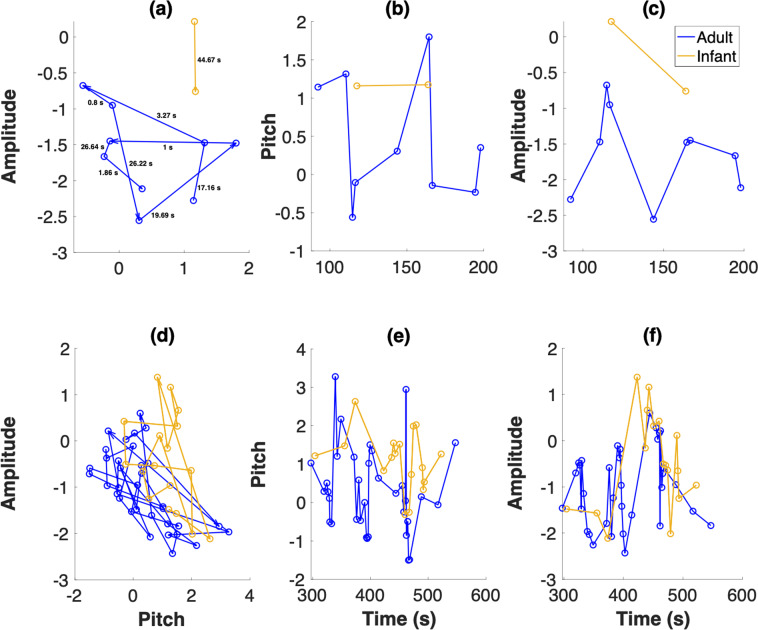
Figure 1.
Sample vocalisation sequences by a 3-month-old infant and the infant’s caregiver(s). (a) shows the movement of the infant (yellow) and adult (blue) in a 2D acoustic space defined by mean pitch and amplitude. Directed arrows indicate the direction of the vocaliser’s movement in the acoustic space. This can be thought of as a foraging process-like depiction. The inter-vocalisation time intervals are indicated. (b,c) Show the same data with time plotted on the X axis, and pitch and amplitude respectively on the Y axis. In (a–c), a vocalisation by the adult is indicated by a blue open circle, and a vocalisation by the infant is indicated by a yellow open circle. Note that these are the same data that is depicted in Fig. 2. (d–f) Show plots for a longer period of time taken from the same recording as in (a–c).

