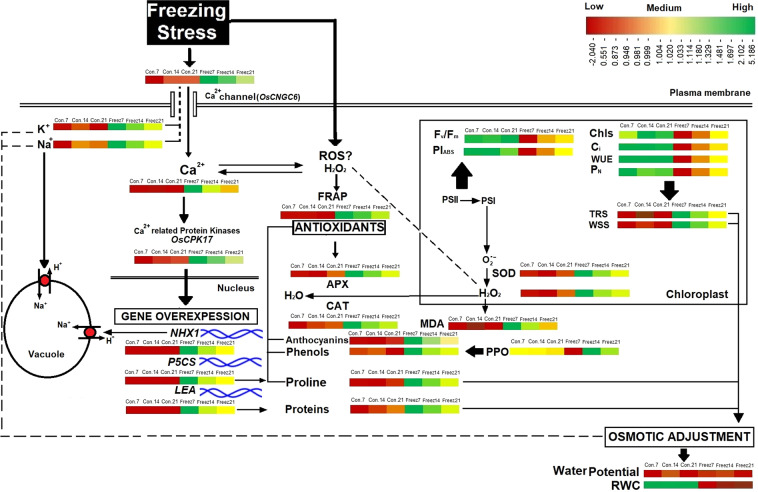
Figure 6.
The pattern of changes in the metabolites of Fritillaria in response to freezing stress. The values are expressed as the changes happened in the parameters as compared to their values in the control plants at 7 days after snowing and then plotted as a heat map with the color scale of red (lowest value) to green (highest value). Data are from control (Con.) and freezing-stressed (Freez.) plants at days 7, 14 and 21 days after snowing (7, 14 and 21 DAS). Anth, anthocyanins; APX, ascorbate peroxidase; CAT, catalase; Chls, total chlorophylls, Ci, intercellular CO2; CNGC, cyclic nucleotide-gated ion channel; CPK, Ca2+ dependent protein kinases; FRAP, total antioxidant power; Fv/Fm, maximum quantum yield of photosystem II; LEA gene, late embryogenesis abundant; MDA, malondealdehyde; NHX1 gene, a vacuolar Na+/H+ antiporter; PIABS, performance indices; PN, net photosynthesis; P5CS gene, PPO, polyphenol oxidase; RWC, relative water content; SOD, super oxide dismutase; TRS, total reducing sugars; WSS, water soluble sugars; WUE, water use efficiency; Ψw, water potential.

