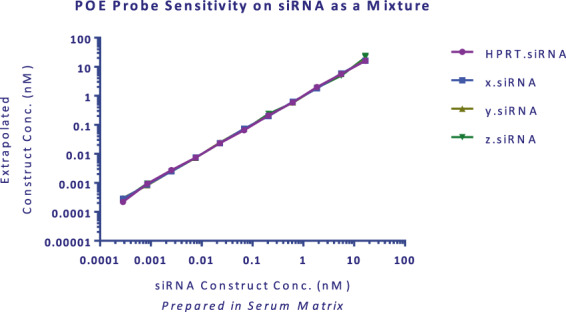
Figure 4.

POE immunoassay probe selectivity to for the antisense strands of four unique siRNAs in a mixture. All siRNA molecules were added to a single calibration curve from 0.3 to 16,700 fM in Sprague Dawley serum. Independent probe sets were used to detect their corresponding antisense strands. Theoretical and back-calculated results were graphed in GraphPad Prism. Non-parametric Friedman test was performed using GraphPad Prism and showed no statistically significant difference at 5% significance level (p value = 0.983) demonstrating no changes in calibration curves when siRNAs prepared as a mixture. Mean data is shown with error bars representing standard deviation.
