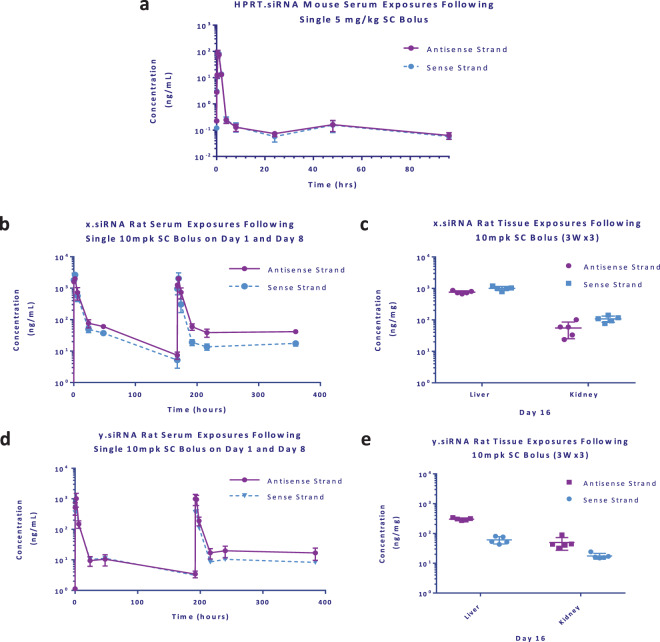
Figure 5.
Serum concentration-time profile and tissue concentration of antisense and sense strands of HPRT.siRNA following a single SC bolus in C57BL/6 mice (a) 0–96 h in serum (n = 2 animals per time point). Serum concentration-time profile of x.siRNA (b) and y.siRNA (d) 0–48 h on day 1 and day 8 following a 10 mg/kg SC Bolus in male Sprague Dawley rats. Corresponding tissue concentrations of x.siRNA (c) and y.siRNA (e) 24 h post-dose following a QWx3 dosing regimen. Rat data plotted as individual replicates (n = 5 animals per time point). Mean data is shown with error bars representing standard deviation.

