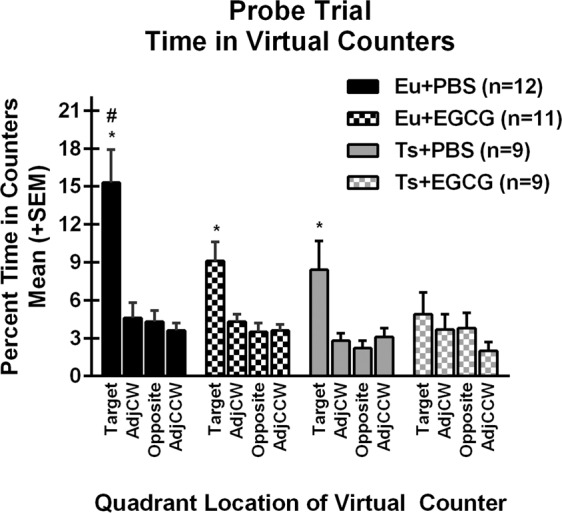
Figure 5.

Morris water maze probe trial search. For each of the four groups, the percent of time (of the 60-second probe trial) that was spent in each of the four virtual counters are shown as function of quadrant relative to the location of the target quadrant (Target, Adjacent-clockwise, Opposite, Adjacent-counterclockwise). Note the significant reduction in target search bias in the trisomic mice, and the reduction in target search bias in the groups given EGCG. *Significantly greater than other three quadrants for the same group; #Significantly greater than the time in Target of all other groups.
