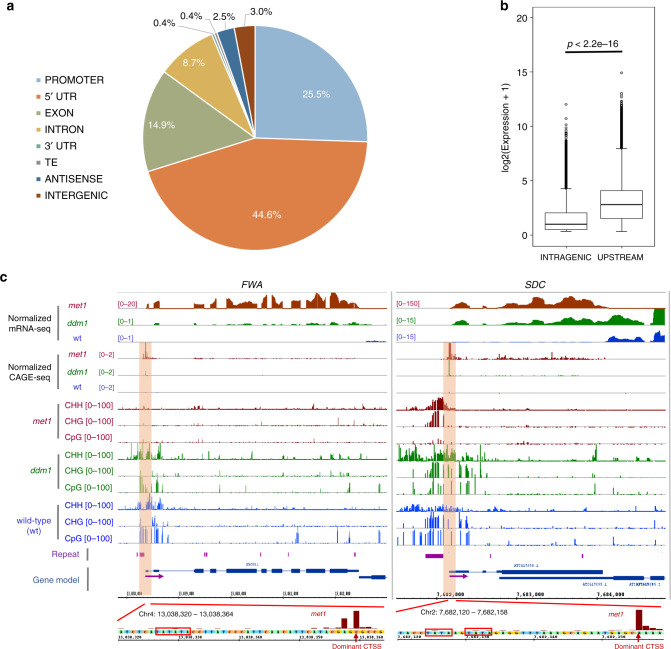
Fig. 1. Characterizing the TSSs identified in wild-typeA. thalianaplant by CAGE-seq.
a Genome-wide distribution of TSSs (n = 26,561) identified in wild-type A. thaliana. Genomic features were used for overlapping test in the following order: PROMOTER > UTR > UTR > INTRON > EXON > ANTISENSE > TE > INTERGENIC. b A boxplot showing that intragenic TSSs are less expressed than their counterparts located in the upstream regions (promoters or UTRs). p-value was calculated by two-sided Mann–Whitney test on the expression of the TSSs. The centerline in the plot represents the median. The bounds of the box are the first and third quartiles (Q1 and Q3). Whiskers represent data range, bounded to 1.5 * (Q3-Q1). Points outside this range are represented individually by hollow circles. c Browser tracks showing the ectopic activation of the TSSs at FWA (AT4G25530) and SDC (AT2G17690) gene loci in the met1 and ddm1 backgrounds (indicated by orange windows). Their dominant CTSSs (red arrows) were aligned to the upstream sequences, indicating the presence of TATA-box motifs (red boxes) encoded within (left panel) or downstream (right panel) of the nearby repeats. Purple arrows indicate the direction of transcription.

