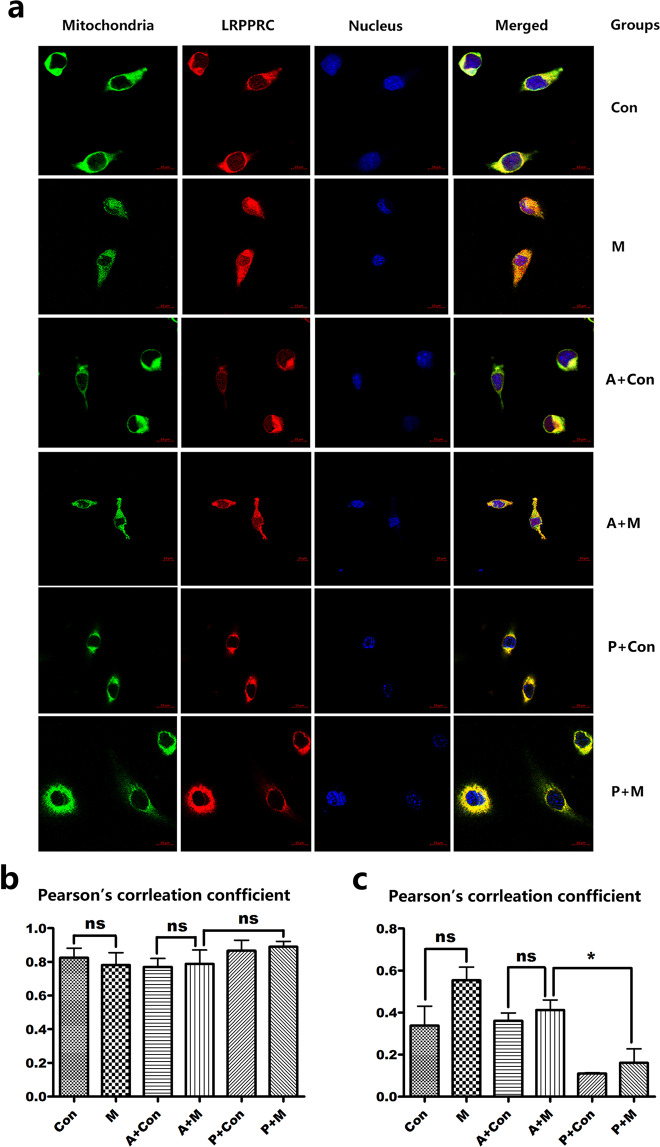
Figure 3.
Subcellular localization of LRPPRC following of PGC-1α overexpression. n = 4; visulization was performed using fluorescence confocal microscopy. (a) The immunofluorescence results of LRPPRC subcellular localization. Mitochondria for 647 channels of excitation light, appear in green; LRPPRC is 594 channels of excitation light, appearing in red; the nucleis are stained by DAPI and appear in blue. Note: Con (control group), M (MPP+ group), A + M (Ad+MPP+ group), A + Con (Ad+control group), P + Con (PGC-1α + control group), P + M (PGC-1α + MPP+ group). (b,c) The Pearson’s corrleation confficient of LRPPRC in mitochondria and nucleus. ns, no statistical significance; *P < 0.05 PGC-1α + MPP+ compared with MPP+.

