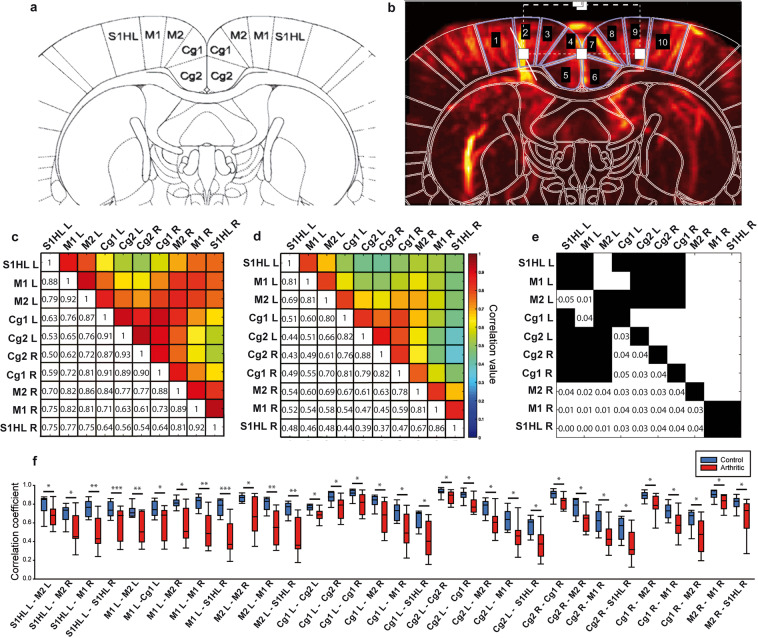
Figure 4.
Correlation matrix analysis of the FC on the −0.6 Bregma plan of the rat brain atlas. (a) Plane of interest of the Paxinos rat brain atlas (Bregma −0.6 mm) and corresponding ROIs (S1HL, M1, M2, Cg1, Cg2 left and right for each), with permission from Elsevier. This image is modified from ‘Rat Brain in Stereotaxic Coordinates’. Paxinos &Watson, Academic Press, San Diego 3rd, (1997). (b) Doppler image of the rat brain with the corresponding mask of the rat brain atlas presented in (a). (c,d) Averaged Pearson correlation matrix for each of the 9 rats in the control and arthritic groups. (e) Matrix of significance of the differences between c (control) and d (arthritic) matrices. White squares represent the pairs of ROIs with a significant alteration in FC between the two groups, with corresponding p-values. (f) Boxplot representation of each pair with a significant FC alteration. N = 9 per group. *p < 0.05, **p < 0.01 and ***p < 0.001, Welch’s test, or Mann-Whitney test in case of non-normality after Fisher transformation, followed by Benjamini-Hochberg’s correction for multiple comparisons.

