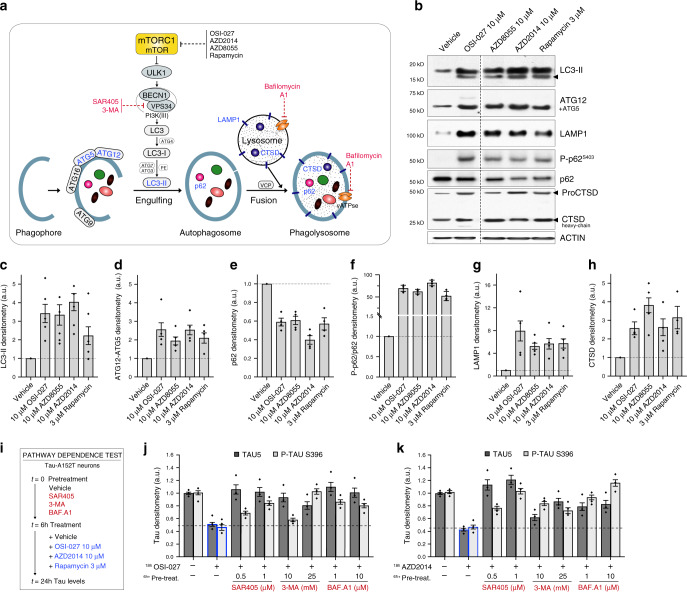
Fig. 4. Compound activation of autophagy as shown by upregulation of pathway-specific markers and pathway-dependence analysis.
a Simplified schematic of the proposed mechanism for mTORi-mediated tau clearance through autophagy. mTORi are shown in black, and autophagy inhibitors in red. b Western blot of autophagy-specific markers (in blue, a) in A152T neurons (6-week differentiated, FTD19-L5-RC6) upon 24 h treatment (samples were run on the same gel, image was cropped on the dotted line only for the purpose of this figure). Blot is representative of n = 4 biological replicates. c–h Graph bars represent mean densitometry relative to vehicle ± SEM, and black diamond-dots indicate individual data points for n = 4 biological replicates (n = 5 for LC3-II). i Assay to test mTORi effect pathway-dependence: A152T (FTD19-L5-RC6) neurons were treated for 6 h with autophagy inhibitors (SAR405, 3-MA, BAF.A1) followed by mTORi (10 μM OSI-027, 10 μM AZD2014) for a total of 24 h. j, k Western blot densitometry of total tau (TAU5) and P-tauS396 levels. Graph bars represent mean tau densitometry ± SEM and black diamond-dots indicate individual data points for n = 3 biological replicates. Corresponding representative blots are included in Supplementary Fig. 5b, c. Source data are provided as a Source Data file.

