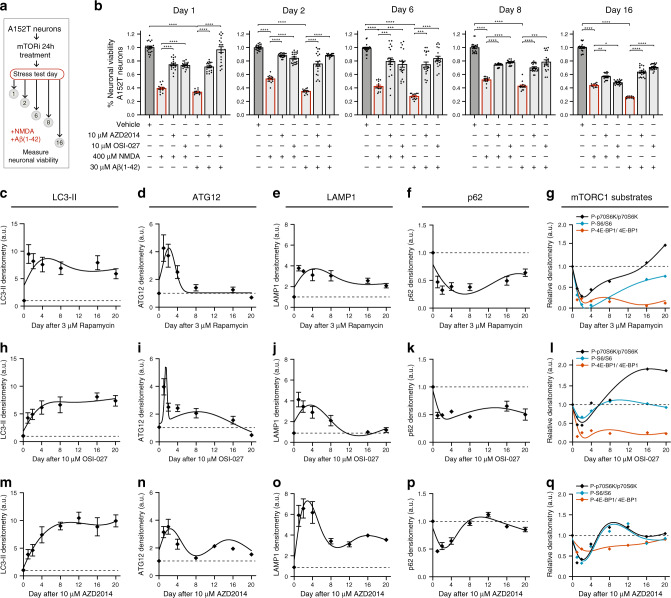
Fig. 8. Time-course analysis of mTORi effect on neuronal vulnerability to stress, autophagy and mTORC1 activity.
a Assay to measure mTORi time-course effect on neuronal vulnerability to stress. A152T neurons (FTD19-L5-RC6, 6 weeks differentiated) were treated with 10 μM AZD2014 or OSI-027 for 24 h (day 0–1), followed by media change. Then, on each day indicated, neurons were stressed with either 400 μM NMDA or 30 μM Aβ(1-42) for 18 h, and viability was measured. b Graph bars represent mean % viability, relative to vehicle ± SEM and diamond dots represent individual data points for n = 3 (and 4 technical replicates per experiment). Statistical significance was calculated with a two-tailed unpaired t-test (*P ≤ 0.05, **P ≤ 0.01, ***P ≤ 0.001, ****P ≤ 0.0001). c–q Neurons were treated with 3 μM rapamycin (c–g), 10 μM OSI027 (h–l) or 10 μM AZD2014 (m–q) and analyzed by western blot over a period of 20 days (Supplementary Fig. 9a, b). c–f, h–k, m–p Time-course densitometry of LC3-II, ATG12, LAMP1 and p62 autophagy protein levels. Data points represent mean densitometry, relative to vehicle-treated samples (dotted lines) ± SEM for n = 3 biological replicates. g, l, q Time-course measure of mTORC1 substrates’ phosphorylation (p70S6K, S6, 4E-BP1). Data points represent mean densitometry, relative to vehicle-treated samples (dotted lines) for n = 2 biological replicates. Source data are provided as a Source Data file.

