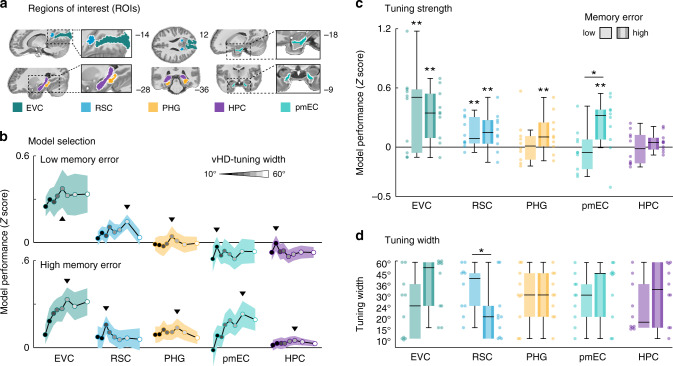
Fig. 5. Region-of-interest (ROI) analysis.
a Human scene-processing and navigation regions tested in this study: early visual cortex (EVC), retrosplenial cortex (RSC), parahippocampal gyrus (PHG), posteromedial entorhinal cortex (pmEC), and the hippocampus (HPC). b Model selection: we plot the model performance (Z score) on ROI level for all basis sets. The black line and the shaded area represent the mean and SEM across participants. Each dot represents the group-average model performance for one basis set, with darker colors representing narrow kernels and lighter colors representing wider kernels. The following kernel widths were tested: 10°, 15°, 20°, 24°, 30°, 36°, 45°, and 60°. The black triangles mark the basis set that leads to the optimal model performance. c Optimal model performance for the two (high- and low-memory-error) participant groups. We plot single-participant data and group-level whisker–boxplots (center, median; box, 25th to 75th percentiles; whiskers, 1.5× interquartile range, n = 2 × 10 participants). We observed directional tuning in EVC and RSC in both groups. In PHG and pmEC, this tuning depended on spatial memory performance. d Optimal tuning width. Similar to b, c we plot the tuning width that led to the optimal model performance selected on individual participant level. Participants with low-memory error had wider tuning than the ones with high-memory error. Hence, unlike tuning strength, the tuning width in RSC reflected spatial memory performance. One-sided (within-group) and two-sided (across-group) permutation-based t-test results were added: **P < 0.05, FDR-corrected, *P < 0.05, uncorrected. Source data are provided as a Source Data file.

