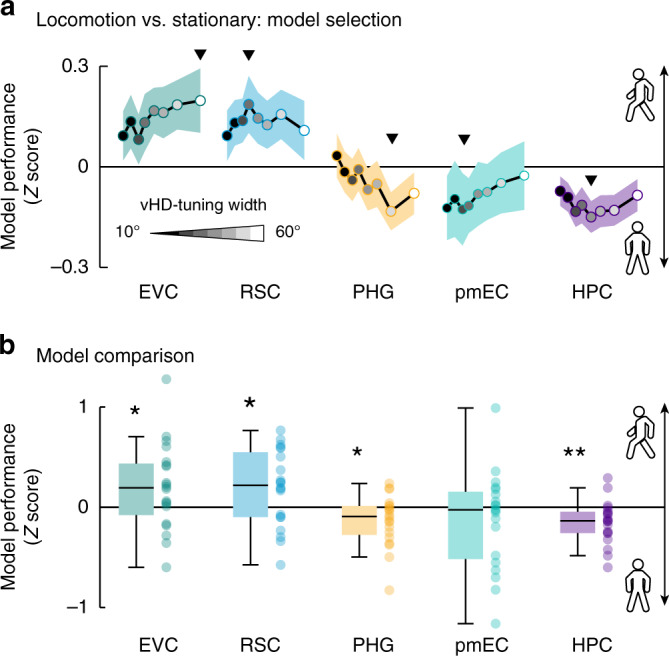
Fig. 6. Behavioral-state analysis.

The analysis described in Fig. 2 was repeated, this time separating periods when participants navigated and when they stood still. a Model selection. We plot the difference in model performance (Z score) between locomotion and stationary periods across tuning widths (grayscale dots represent tuning width: narrow:dark, wide:light, also see Fig. 5). Positive values indicate that voxel time courses in an ROI could be better predicted when participants locomoted. Negative values indicate the opposite, with better model performance during stationary periods. Triangles mark the kernel width, leading to the strongest difference between models. b Model comparison. We plot the difference in model performance indicated in (a) as single-participant data and group-level whisker–boxplots (center, median; box, 25th to 75th percentiles; whiskers, 1.5× interquartile range, n = 20 participants). EVC and RSC tended to be better predicted during locomotion; PHG and HPC could be better predicted during stationary periods. These results suggest that the tuning in visual and mnemonic regions depends on the locomotory state. Two-sided permutation-based t-test results were added: **P < 0.05, FDR-corrected, *P < 0.05, uncorrected. Source data are provided as a Source Data file.
