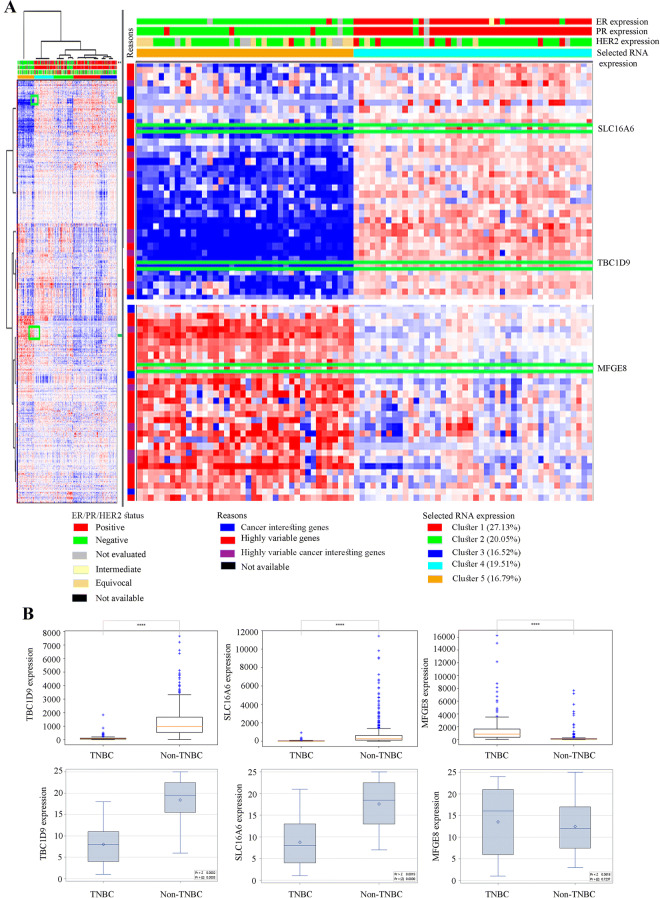
Figure 3.
Analysis of the potential of the three selected genes to differentiate TNBC from non-TNBC based on their expression pattern. (A) The TCGA provisional dataset (tcga_rnaseqV2_brca_v2.0_gene_sample) consisting of 1,101 patients and 1,108 samples was analyzed in cbioportal to see the difference in the expression level of the three selected genes (TBC1D9, SLC16A6 and MFGE8) in TNBC and non-TNBC patients. (B) mRNA expression of the selected genes in TNBC and non-TNBC patients. The first row shows the data from 877 patients from the dataset TCGA-BRCA (nationwidechildrens.org_clinical_patient_brca.txt), which consists of 140 TNBC and 737 non-TNBC patients. The second row is the expression in patients from our tissue repository (TNBC = 13; non-TNBC = 12). The statistical analysis score is the distribution of Wilcoxon rank sum test. **** = p value < 0.0001.

