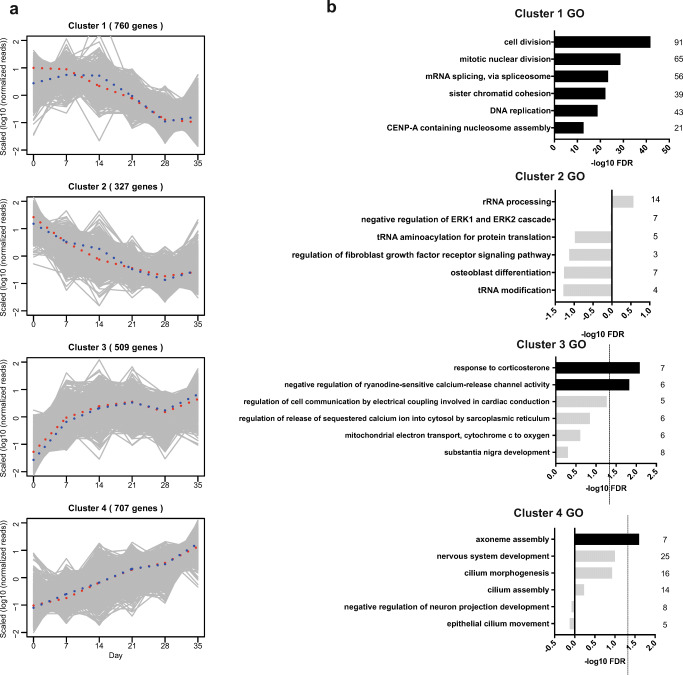
Fig. 3.
Clustering by time course gene expression analysis. a Clustering of all differentially expressed genes by time course expression pattern analysis resulting in clusters 1–4. b GO terms of biological processes associated to the clusters. GO terms of six top ranked biological processes are shown. Terms with FDR < 0.05 are displayed in black terms and terms with FDR > 0.05 are displayed in gray. The dashed line indicates the limit of FDR = 0.05. The number of genes in each category is indicated on the right of the bars. FDR false discovery rate

