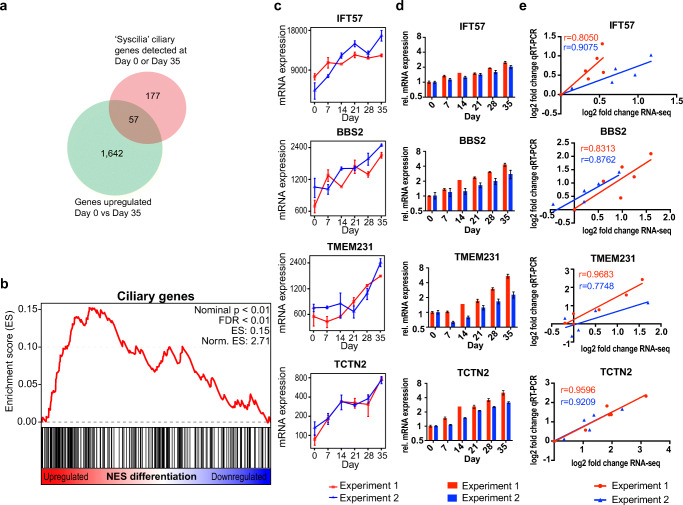
Fig. 4.
Time course expression pattern of ciliary genes. a Venn-diagram of all upregulated genes day 0 vs day 35 and all “Syscilia” ciliary genes detected at day 0 or 35. b Gene set enrichment analysis (GSEA) of “Syscilia” ciliary genes in all detected 11,180 genes. FDR false discovery rate, ES enrichment score. c RNA-seq time course progression plot of the ciliopathy-related genes IFT57, BBS2, TMEM231, TCTN2. d qRT-PCR showing upregulation of the dyslexia and ciliopathy-related genes IFT57, BBS2, TMEM231, TCTN2 during neuronal differentiation. e Correlation plots of log2 fold change in RNA-seq vs. log2 fold change in RT-qPCR. r denotes Pearson correlation coefficient. c, d Mean ± SEM are displayed. c, d, e red: Experiment 1, blue: Experiment 2. Norm. normalized, rel. relative

