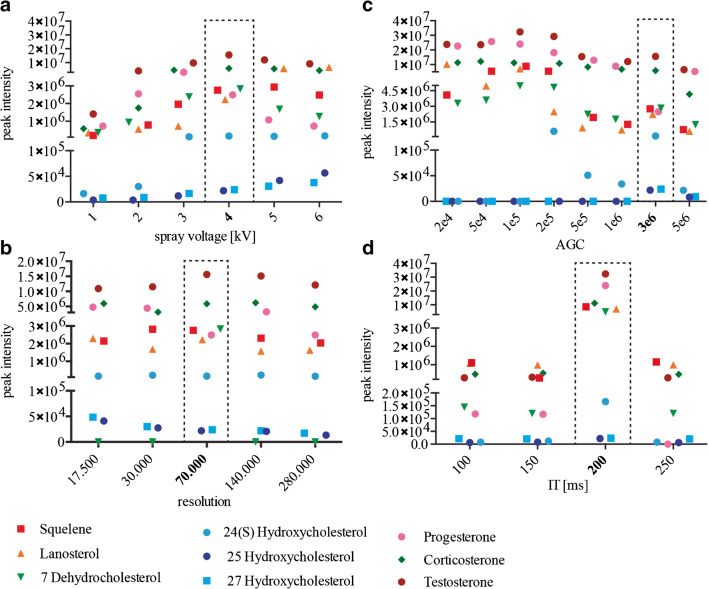
Fig. 1.
Optimization of the MS parameters: MS parameters that were tested in this study. a Peak intensities of all tested compounds with different spray voltages. b Peak intensities of all tested compounds with all available resolutions. c Peak intensities of all tested compounds with several AGC. d Injection times. Each data point is the mean value of an experimental triplicate. Relative standard deviations for all measurements are reported in ESM Tables S1-S4. Optimal conditions are indicated using a dotted box

