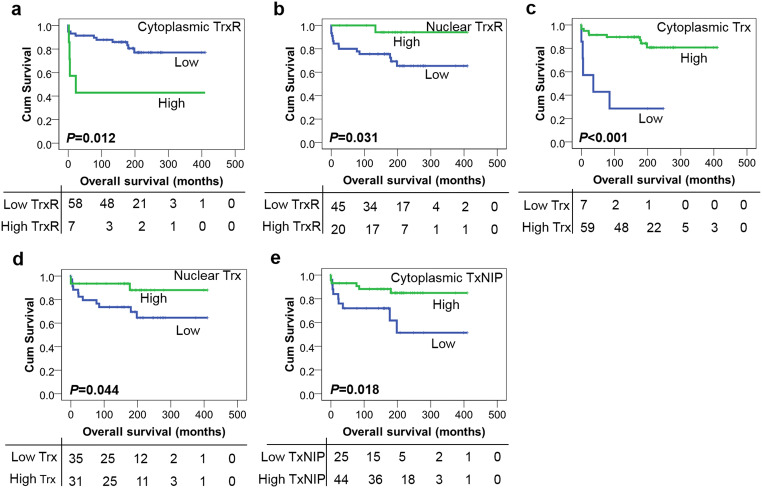
Fig. 3.
Kaplan–Meier overall survival curves in the paediatric LGG cohort. a High expression of cytoplasmic TrxR is associated with adverse overall survival (P = 0.012) whilst high expression of nuclear TrxR (b) is correlated with better overall survival (P = 0.031). High expression of cytoplasmic (c) or nuclear (d) Trx is associated with improved overall survival (P < 0.001 and P = 0.044, respectively). e High expression of TxNIP is also associated with better overall survival (P = 0.018). Curves show low (blue line) and high protein expression (green line) with significance determined using the log-rank test. The numbers below the Kaplan–Meier curve are the number of patients at risk at the specified month

