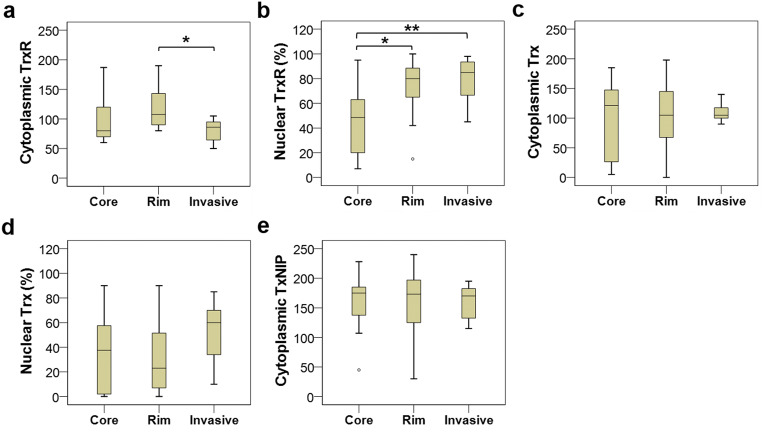
Fig. 6.
Box plots of protein expression in different regions of adult GBM tumours. (a) A significantly higher expression of cytoplasmic TrxR is noted in the rim samples compared with the invasive samples (P = 0.036 on post hoc t test). (b) Significant differences in nuclear TrxR expression were observed between core and rim regions (P = 0.019) and between core and invasive regions (P = 0.004) but not between rim and invasive regions (P = 0.724). No statistically significant variations are detected between areas for cytoplasmic or nuclear Trx (c and d, respectively) or TxNIP expression (e). *P < 0.05, **P < 0.01

