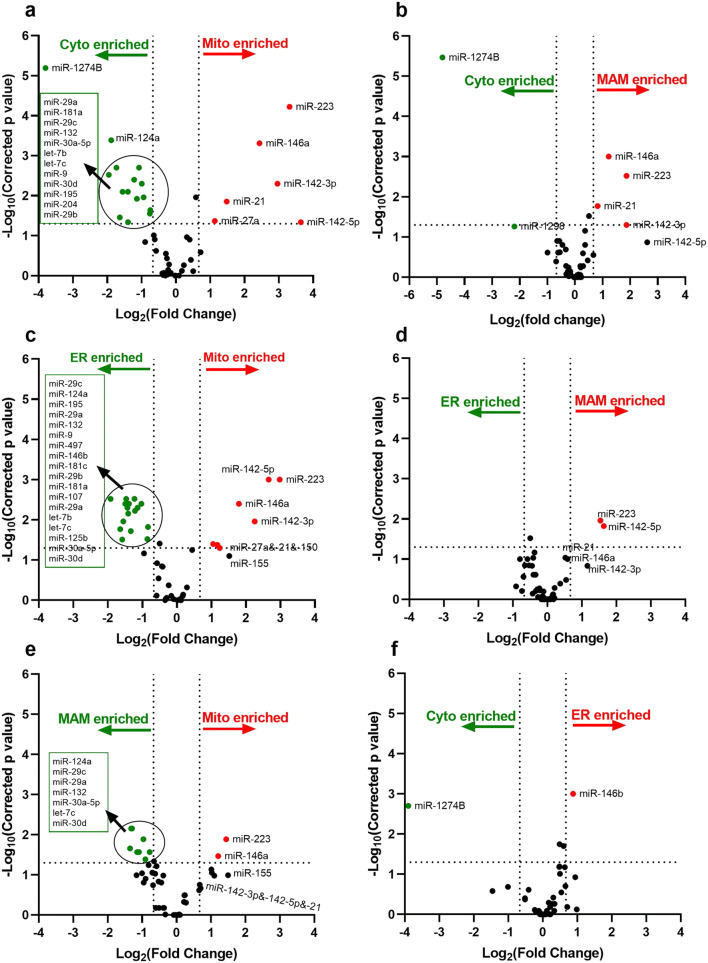
Fig. 5.
Volcano plots of miRNA expression levels in subcellular fractions isolated from human cortices. Cytosol (pCyto), mitochondria (pMito), MAM, and ER subcellular fractions (n = 6 individual human cases) were analyzed for miRNA expression using a neurodegenerative disease-focused, custom miRNA TaqMan® Low-Density Array (TLDA) panel. The global mean normalization method was used to normalize TLDA Ct values. Each plot provides a visual representation of the degree of miRNA enrichment in paired subcellular fractions (e.g., Cyto enrichment vs. Mito enrichment). Levels of miRNA expression in the subcellular fractions were evaluated using unpaired Student’s t test and Benjamin–Hochberg multiple testing to correct p values. A corrected p value < 0.05 was considered being statistically significant. The X-axis is the log2 of the fold change between the two subcellular fractions, and the Y-axis is the negative log10 of the corrected p value. The horizontal dash line (Y = 1.3) corresponds to a threshold p value of 0.05 (Y = − Log10(0.05) = 1.3) and the vertical dash lines corresponds to a threshold of 1.5-fold increased or decreased level (X = Log2(± 1.5) = ±0.67). In each panel, miRNAs with a significant (corrected p < 0.05) increase of more than 1.5-fold are colored in red and those with a significant (corrected p < 0.05) decrease of more than 1.5-fold are colored in green. The plots represent the comparison between: mitochondria and cytosol (a), MAM and cytosol (b), mitochondria and ER (c), MAM and ER (d), mitochondria and MAM (e), ER and cytosol (f)

