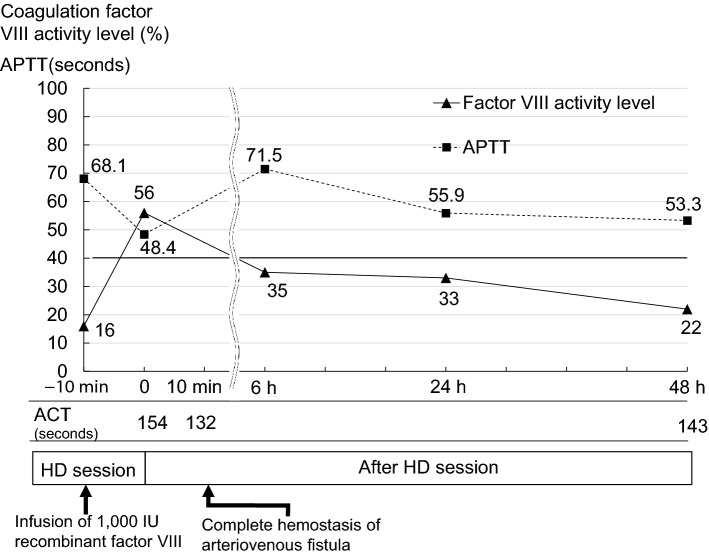
Fig. 2.
Changes in coagulation factor VIII activity level and APTT after recombinant factor VIII infusion. The x-axis shows the time from the end of the HD session. The y-axis shows the factor VIII activity level and APTT concentration. The factor VIII activity peaked 10 min after administration of recombinant factor VIII. ACT activated clotting time; APTT activated partial thromboplastin time; HD hemodialysis

