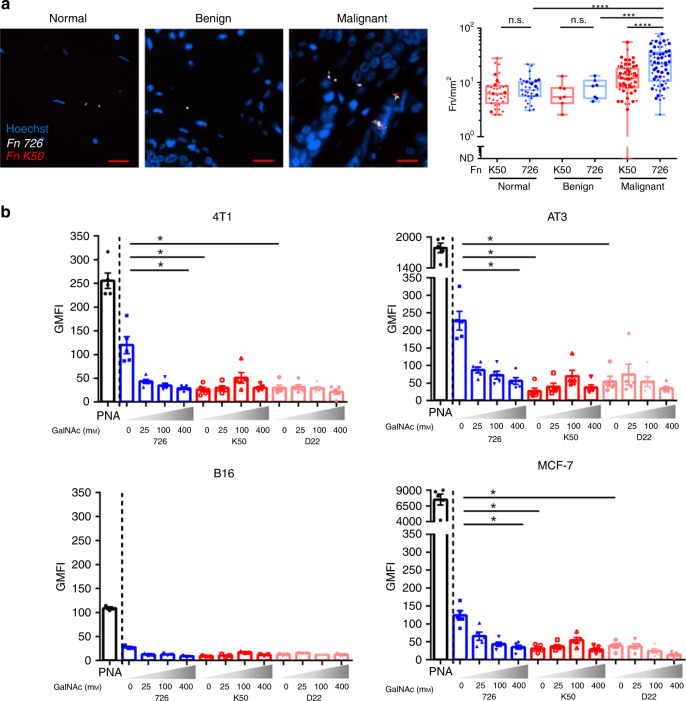
Fig. 3. Attachment of F. nucleatum ATCC 23726 to breast cancer is Fap2-mediated and Gal-GalNAc dependent.
a Representative images (left panels, scale bar 20 µm) and quantitative analysis (Fn/mm2) (right panel) of binding of Cy3-labeled (white) WT F. nucleatum ATCC 23726 (726) and of its Cy5-labeled (red) Fap2-inactivated isogenic mutant K50, to Hoechst-stained (blue) human breast cancer TMAs (HBre-Duc060CS-01 and BR1006). Results in the right panel are classified by tissue type (normal n = 35, benign n = 7, malignant n = 64) and bacterial strain (K50, 726). Each core is measured twice, once for each of the strains in the appropriate tissue type (as demonstrated in the pictures). When an individual contributed a single core to the experiment, the two observations are shown as circles (●); when she contributed two cores, these were to the normal type and the malignant type, and the four observations are depicted as plus signs (+). The six classes were compared against each other in pairs: the exact two-tailed Wilcoxon test was used for pairs that were from the same core, the exact two-tailed Mann–Whitney test for independent samples. Where the same hypothesis was tested on more than one pair, and the individual pairs were mutually independent, the corresponding p-values were combined by Fisher’s method. Wherever the pairs were not independent, the multiple comparisons were adjusted for using the Holm modification of the Bonferroni correction. ****p < 0.0001, ***p = 0.00079, n.s.: not significant. b Flow cytometry analysis of attachment of FITC-labeled PNA and of FITC-labeled F. nucleatum ATCC 23726 (726) and its Fap2-inactivated isogenic mutants K50 and D22 to breast cancer cell lines 4T1, AT3 (mouse cell lines), MCF-7 (human cell line) (n = 5 each), and mouse melanoma cell line B16 used as a control (n = 3), in the absence or presence of increasing amounts of soluble GalNAc. Bars indicate mean ± SEM. Each symbol represents average of 10,000 cells examined in duplicate. Data shown are representative of two independent experiments. *p = 0.0313, one-tailed, Wilcoxon matched-paired signed rank test (726, 0 mM–726, 400 mM GalNAc). *p = 0.0119 (all others), Holm-corrected one-tailed Mann–Whitney test. Source data are provided as a Source data file.

