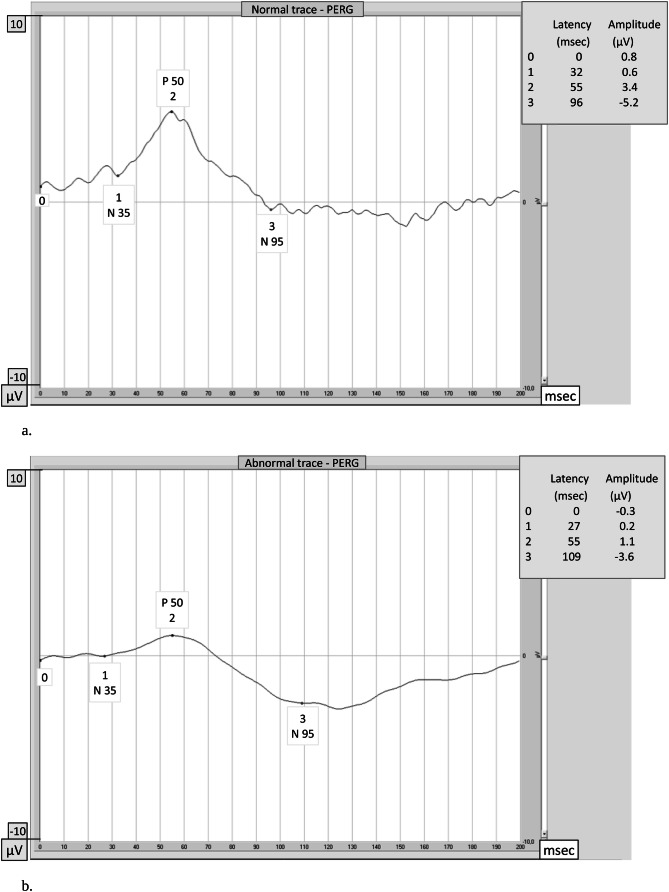
Figure 2.
The pattern electroretinogram (PERG) waveform in normal subjects contains three components: a small negative component with a latency of approximately 35 ms (N35, #1), a much larger positive component at approximately 50 ms (P50, #2) and a large negative component at approximately 95 ms (N95, #3). Latencies are expressed as absolute values. The amplitudes are measured between peaks and troughs: the P50 amplitude from the trough of N35 (#1) to the peak of P50 (#2), and the N95 amplitude from the peak of P50 (#2) to the trough of N95 (#3). Amplitudes are expressed as differential values. (a) Normal PERG. In this normal subject the P50 latency is 55 ms, the P50 amplitude is 3.4 μV, the N95 latency is 96 ms and the N95 amplitude is 5.2 μV: PERG amplitudes and latencies of P50 and N95 waves are within normal limits. (b) Abnormal PERG. In this patient affected by glaucoma PERG amplitudes of P50 (#2) and N95 (#3) waves are reduced (1.1 μV and 3.6 μV) and latencies are delayed (55 ms and 109 ms) in comparison with normal.

