Figure 3.
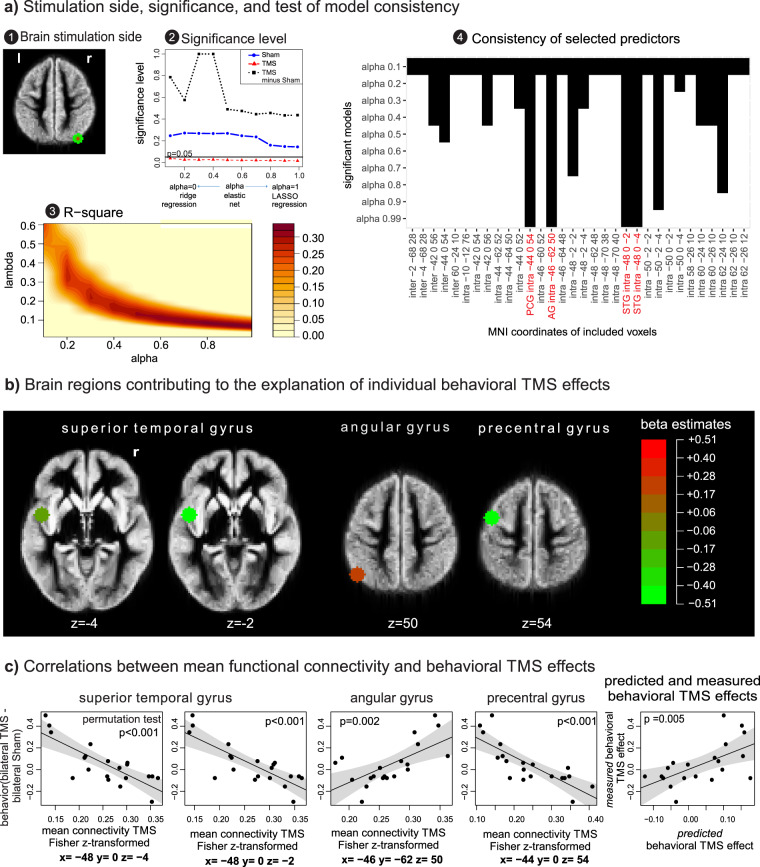
Connectivity states associated with behavioral TMS effects. An elastic net analysis was performed to explain the variation in behavioral TMS effects by the voxel-wise mean connectivity measured following (i) Sham, (ii) TMS stimulation, and (iii) by the change of mean connectivity following TMS. (a) Stimulation side, significance, and test of model consistency. Plot 1: The position of the TMS coil on P4 showed the smallest average distance to the right angular gyrus. Plot 2: Mean functional connectivity following TMS showed a significant association with behavioral TMS effects. Data points below the black horizontal line indicate significant p-values (p < 0.05). Plot 3: Proportion of variance explained by the model, as estimated by cross-validation as function of alpha and lambda. Models with a large relative contribution from the lasso ℓ1 norm penalty (large alpha), and therefore only few regressor variables, tended to show better associations. Plot 4: For each of the ten significant models, brain regions that received non-zero regression coefficients and contributed to the model are graphically illustrated by black bars. All significant models include the same four regressor variables with non-zero coefficients that were also selected for the model with the best significance level. The corresponding voxel positions are presented in MNI coordinates. STG: superior temporal gyrus, AG: angular gyrus, PCG: precentral gyrus, inter: interhemispheric connectivity, intra: intrahemispheric connectivity. (b) Brain regions contributing to the explanation of individual behavioral TMS effects. The anatomical positions of the four selected regressors included within the model with the smallest p-value are illustrated. For each of these brain regions, only the mean intra-hemispheric functional connectivity (and not the inter-hemispheric connectivity) was selected as regressor. The size of the estimated regression coefficients is color-coded. Voxel sizes of the explanatory brain regions were increased for illustrative reasons and plotted on co-registered and normalized T1 group mean images. (c) Correlations between mean functional connectivity and behavioral TMS effects. The single correlation between mean functional connectivity following TMS and the behavioral TMS effects are illustrated for each brain region selected in the elastic net analysis. Right plot: The correlation between predicted and measured behavioral TMS effects is shown.

