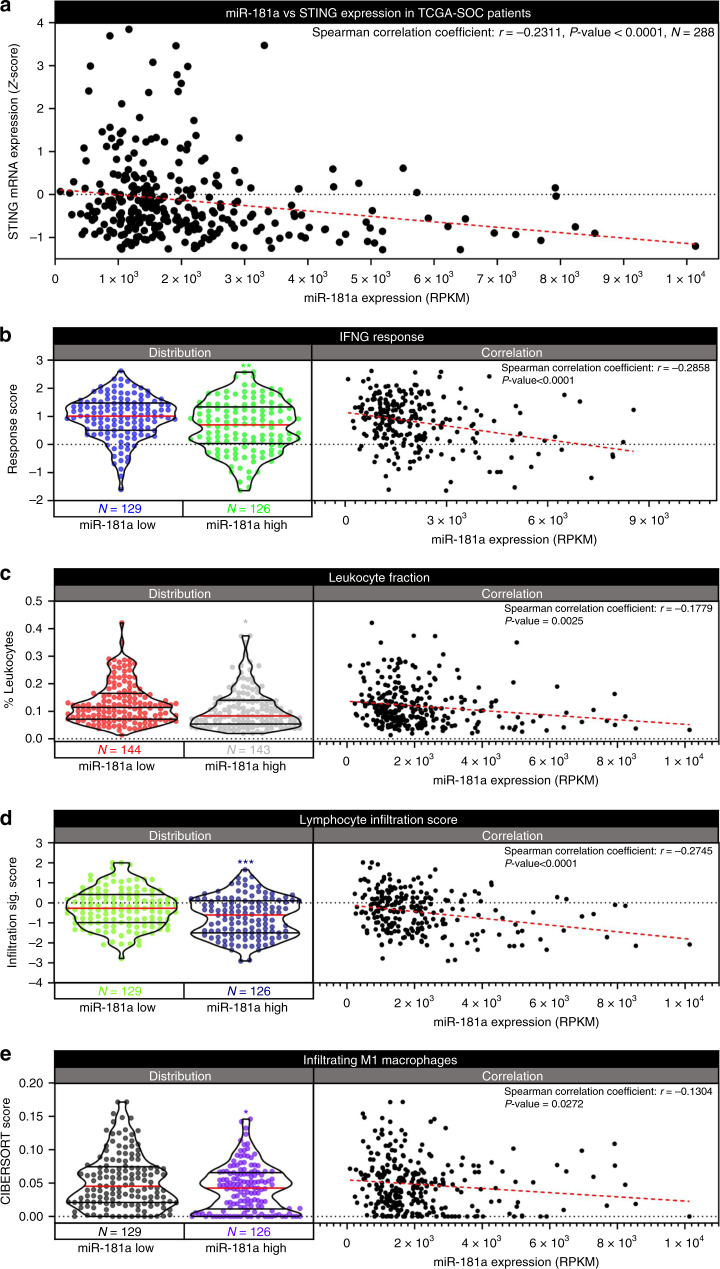
Fig. 10. miR-181a inversely correlates with immune activation in HGSOC patient tumors.
a Graph of TCGA-SOC patient correlation analysis of miR-181a vs STING expression with Spearman correlation coefficient and p value (upper right). b Violin plot of IFNG Response score distribution in the miR-181a Low and miR-181a High subpopulations of TCGA-SOC patients (Left) along with correlation analysis graph of miR-181a expression vs IFNG Response score across all TCGA-SOC patients (Right). c Violin plot of leukocyte fraction distribution in the miR-181a Low and miR-181a High subpopulations of TCGA-SOC patients (Left) along with correlation analysis graph of miR-181a expression vs leukocyte fraction across all TCGA-SOC patients (Right). d Violin plot of lymphocyte infiltration score distribution in the miR-181a Low and miR-181a High subpopulations of TCGA-SOC patients (Left) along with correlation analysis graph of miR-181a expression vs lymphocyte infiltration score across all TCGA-SOC patients (Right). e Violin plot of Infiltrating M1 Macrophage score distribution in the miR-181a Low and miR-181a High subpopulations of TCGA-SOC patients (Left) along with correlation analysis graph of miR-181a expression vs Infiltrating M1 Macrophage score across all TCGA-SOC patients (Right). Numbers of patients in miR-181a Low and High subpopulations are located below left graph. Linear regression of correlation analysis in right graph is shown as dashed red line. Spearman’s rank order correlation analysis was used for statistical analysis. Spearman correlation coefficient and p value for correlation analysis is shown in upper right. *p < 0.05, **p < 0.005, ***p < 0.0005.

