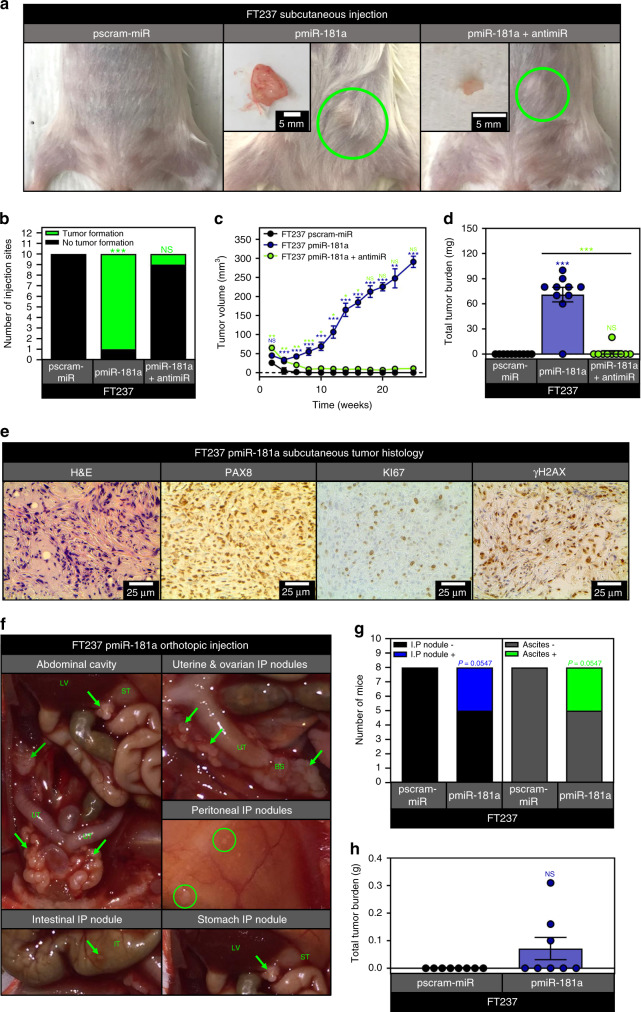
Fig. 2. miR-181a promotes FTSEC tumor formation in vivo.
a Pictures showing representative images of subcutaneous tumor formation at 25 weeks post injection for the FT237 pscram-miR, pmiR-181a, and pmiR-181a + antimiR groups with insets depicting excised tumors. b Graph showing the number of subcutaneous injection sites that formed palpable tumors by 25 weeks for each group of mice injected with either FT237 pscram-miR, pmiR-181a, or pmiR-181a + antimiR cells. c Graph depicting tumor growth kinetics for the FT237 pscram-miR, pmiR-181a, and pmiR-181a + antimiR subcutaneous injection groups. Error bars represent ±SEM. Significance values are color coded to match the corresponding mouse injection group. d Scatter plot showing total tumor burden for the FT237 pscram-miR, pmiR-181a, and pmiR-181a + antimiR subcutaneous injection groups. N = 10 for all groups. e Representative micrographs of subcutaneous FT237 pmiR-181a tumors stained with either H&E (far left), PAX8 (left), KI-67 (right), or γH2AX. f Representative images showing intraperitoneal nodule formation in FT237 pmiR-181a mice: (top left) gross anatomy (bottom left) IP nodule located on intestine (top right) magnified view of uterine and ovarian IP nodules, (middle right) peritoneal IP nodules, (bottom right) stomach IP nodule. g Graph showing the number of intraperitoneally injected mice that formed intraperitoneal nodules or ascites by 25 weeks for each group of mice injected with either FT237 pscram-miR or FT237 pmiR-181a cells. h Scatter plot showing total tumor burden for the FT237 pscram-miR and pmiR-181a intraperitoneal injection groups. N = 8 for both groups. All data are representative of N = 3 independent experiments unless otherwise stated. The measure of center for the error bars is given as the mean value unless otherwise stated. The statistical test used for data analysis is the two-sided Student’s t test unless otherwise stated. Fisher’s exact test was used for statistical analysis in b and g. Mann–Whitney test was used for statistical analysis in d and h. Error bars indicate ± standard deviation unless otherwise stated. *p < 0.05, **p < 0.005, ***p < 0.0005.

