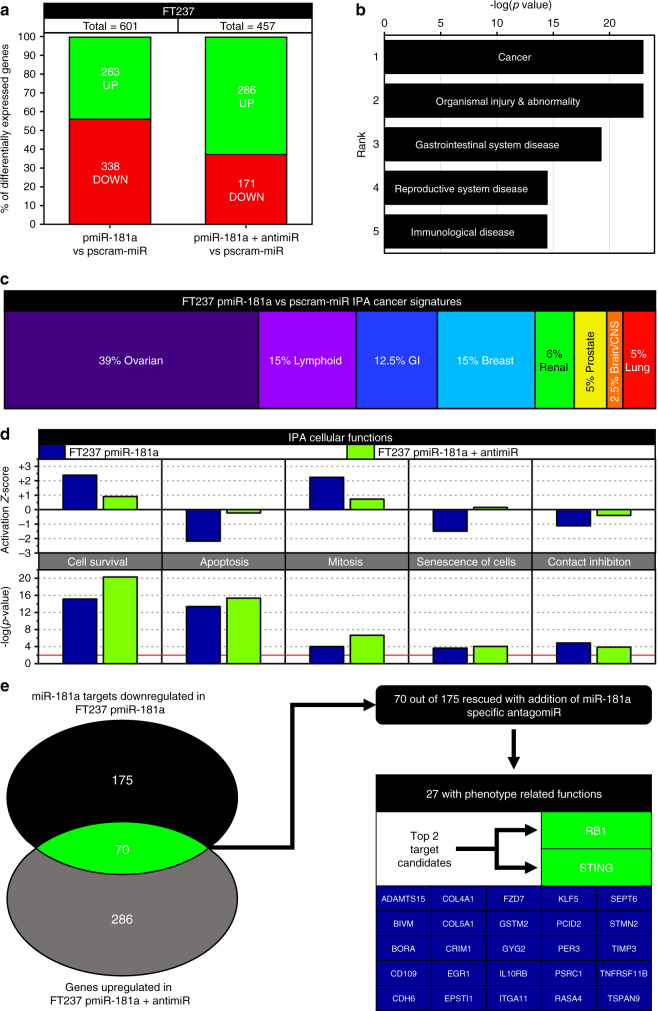
Fig. 5. miR-181a promotes tumorigenic changes in gene expression associated with oncogenic transformation and ovarian cancer.
a Graph of the percent of differentially expressed genes in FT237 pmiR-181a vs pscram-miR and FT237 pmiR-181a + antimiR vs pscram-miR along with the total number of genes differentially expressed for each cell line. b Graph of the –log(p values) for the top 5 ranked IPA Diseases and Functions groups significantly associated with the FT237 pmiR-181a cells. c Graph showing the relative percentages of IPA Cancer Signatures subgroups significantly associated with the FT237 pmiR-181a cells. d Graph comparing IPA Cellular Functions associated with tumorigenesis in the FT237 pmiR-181a vs pmiR-181a and antimiR cells. (Left) graph of IPA Cellular Functions Activation z-scores for the FT237 pmiR-181a and pmiR-181a + antimiR. (Bottom) graph of IPA Cellular Functions –log(p values) for the FT237 pmiR-181a and pmiR-181a + antimiR. e Diagram of the criterion filter selection process used to determine the miR-181a targets driving transformation and genomic instability in the FTSECs. All data are representative of N = 3 independent experiments unless otherwise stated. The measure of center for the error bars is given as the mean value unless otherwise stated. The statistical test used for data analysis is the two-sided Student’s t test unless otherwise stated. Error bars indicate ±standard deviation unless otherwise stated. *p < 0.05, **p < 0.005, ***p < 0.0005.

