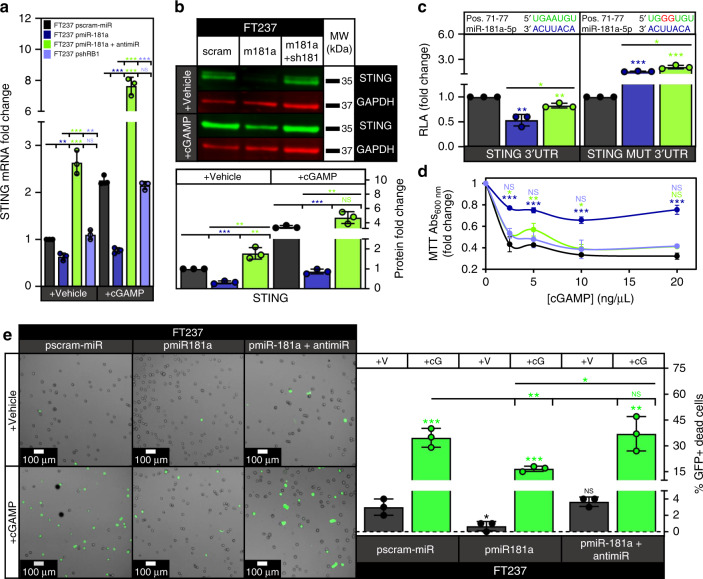
Fig. 8. miR-181a allows FTSECs to bypass intrinsic interferon response by targeting STING.
a Graph showing STING mRNA expression in the FT237 pscram-miR, pmiR-181a, pmiR-181a + antimiR, and pshRB1 cells treated with either lipofectamine vehicle or the STING agonist cGAMP. b Representative western blot showing STING protein expression in the FT237 pscram-miR, pmiR-181a, and pmiR-181a + antimiR cells treated with either lipofectamine or cGAMP with quantification below. c Graph showing STING 3′UTR and mutant 3′UTR relative luciferase activity for the FT237 pscram-miR, pmiR-181a, and pmiR-181a + antimiR cells. miR-181a binding sites within the 3′UTR are depicted in green. Mutated nucleotides within the 3′UTR are depicted in red. d Graph showing cell viability of FT237 pscram-miR, pmiR-181a, pmiR-181a + antimiR, and pshRB1 cells 24 h after treatment with either lipofectamine vehicle or lipofectamine + increasing doses of cGAMP. e Images showing representative micrographs (left) and quantification (right) of FT237 pscram-miR, pmiR-181a, and pmiR-181a + antimiR GFP + dead cells 24 h after treatment with either lipofectamine vehicle or lipofectamine + 10 µg of cGAMP. All data are representative of N = 3 independent experiments unless otherwise stated. The measure of center for the error bars is given as the mean value unless otherwise stated. The statistical test used for data analysis is the two-sided Student’s t test unless otherwise stated. Error bars indicate ± standard deviation unless otherwise stated. *p < 0.05, **p < 0.005, ***p < 0.0005. Full western blots shown in Supplementary Fig. 11.

