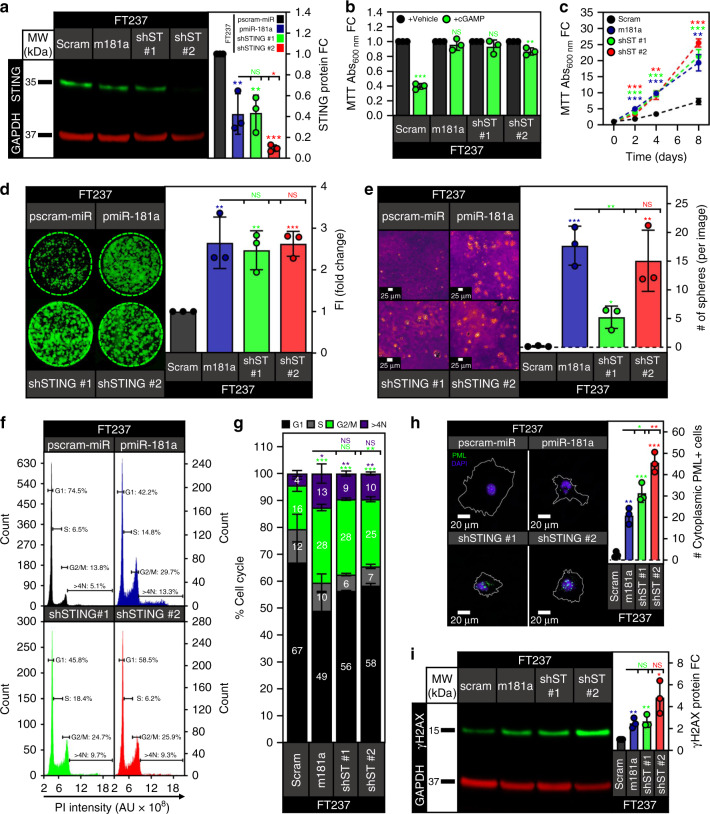
Fig. 9. Knockdown of STING phenocopies miR-181a overexpression in FTSECs.
a Representative western blot of STING protein expression in FT237 pscram-miR, pmiR-181a, shSTING #1, and shSTING #2 cells with quantification on the right. b Graph of cell viability for FT237 pscram-miR, pmiR-181a, shSTING #1, and shSTING #2 cells 24 h after treatment with either lipofectamine vehicle or lipofectamine + 10 µg of cGAMP (top). c Graph of cell viability growth curves for FT237 pscram-miR, pmiR-181a, shSTING #1, and shSTING #2 cells (bottom). d Colony formation assay showing survival and colony formation for the FT237 pscram-miR, pmiR-181a, shSTING #1, and shSTING #2 cells with quantification on the right. Colonies were stained with CellTag 700 at 10 days. Dashed green lines denote the culture plate well boundaries. e Micrographs showing anchorage independent growth of FT237 pscram-miR, pmiR-181a, shSTING #1, and shSTING #2 cells with quantification on the right. f Representative graphs of cell cycle profiles for FT237 pscram-miR, pmiR-181a, shSTING #1, and shSTING #2 cells. g Graph depicting quantification of cell cycle subpopulations for FT237 pscram-miR, pmiR-181a, shSTING #1, and shSTING #2 cells. h Immunofluorescence micrographs of representative PML staining for the FT237 pscram-miR, pmiR-181a, shSTING #1, and shSTING #2 cells. PML bodies are stained green, DAPI stained nuclei are colored purple, and the outline of the cell is depicted in white. Quantification of the % cytoplasmic PML + cells for each cell line is located on the right. i Representative western blot of γH2AX protein levels in the FT237 pscram-miR, pmiR-181a, shSTING #1, and shSTING #2 cells with quantification on the right. All data are representative of N = 3 independent experiments unless otherwise stated. The measure of center for the error bars is given as the mean value unless otherwise stated. The statistical test used for data analysis is the two-sided Student’s t test unless otherwise stated. Error bars indicate ± standard deviation unless otherwise stated. *p < 0.05, **p < 0.005, ***p < 0.0005. Full western blots shown in Supplementary Fig. 11.

