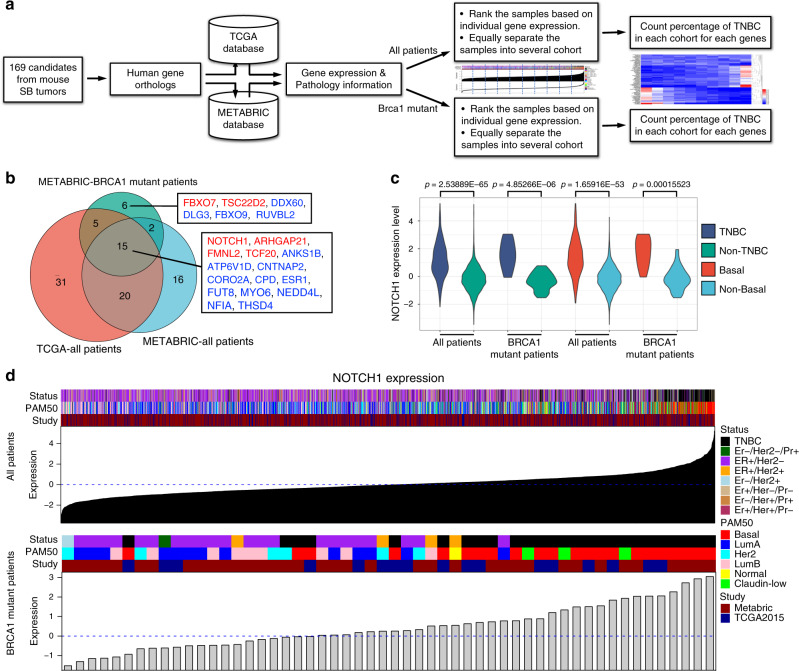
Fig. 6. Correlation of NOTCH1 expression with human TNBC and basal-type breast cancer.
a Flowchart illustrating the strategy of TNBC correlation analysis for candidate genes. b Venn diagram showing TNBC-correlated genes obtained from TCGA and METABRIC databases. Genes labelled with red correlated positively with TNBC incidence, and genes highlighted with blue correlated negatively. c Distribution of NOTCH1 expression levels in TNBC vs. non-TNBC and basal vs. non-basal human patients. The t-test was used to determine the significance of differences between the different sets of data. d Correlation between NOTCH1 expression level and tumour subtype. Tumours were ranked based on NOTCH1 expression level, and tumour subtypes are labelled on the top. Data were obtained from TCGA (n = 403) and METABRIC (n = 1898) databases.

