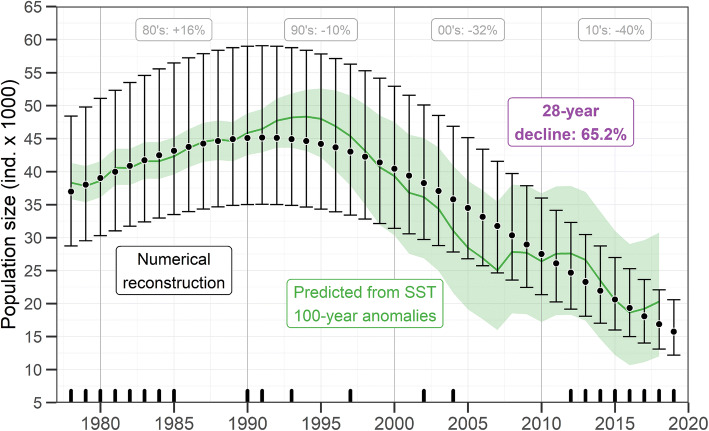
Figure 3.
Historical population size of California sea lions (Zalophus californianus) in the Gulf of California. Annual medians (black dots) and 95%-credible intervals (CI; black error bars) of the numerical reconstruction are shown. Black inner ticks on the X axis mark the years for which any colony count was available. Medians of decadal changes and the 28-year decline in percentage are within gray and purple boxes, respectively. The population size prediction from the multi-decadal anomalies of sea surface temperature (SST) is shown as a green thick line (median) and green shaded area (95%-CI).

