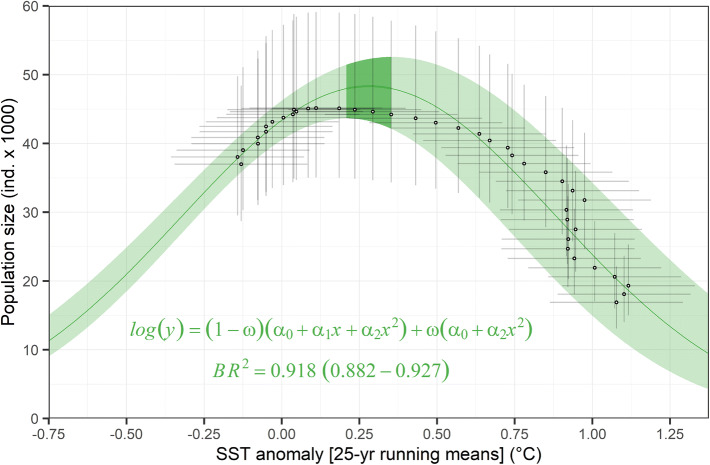
Figure 5.
The California sea lion (Zalophus californianus) population size in the Gulf of California as a function of sea surface temperature (SST) multi-decadal anomalies from the 100-year mean of 22.24 °C (range 22.02–22.45). The green line and shaded area are the median prediction and the 95%-credible interval (CI), respectively. The darker line and shaded area represent the multi-decadal habitat optimum, between + 0.17 and + 0.40 °C. Black dots and thin error bars are the medians and 95%-CIs of the annual estimations of both variables. The posterior summaries of the equation’s parameters are portrayed in Table 1.

