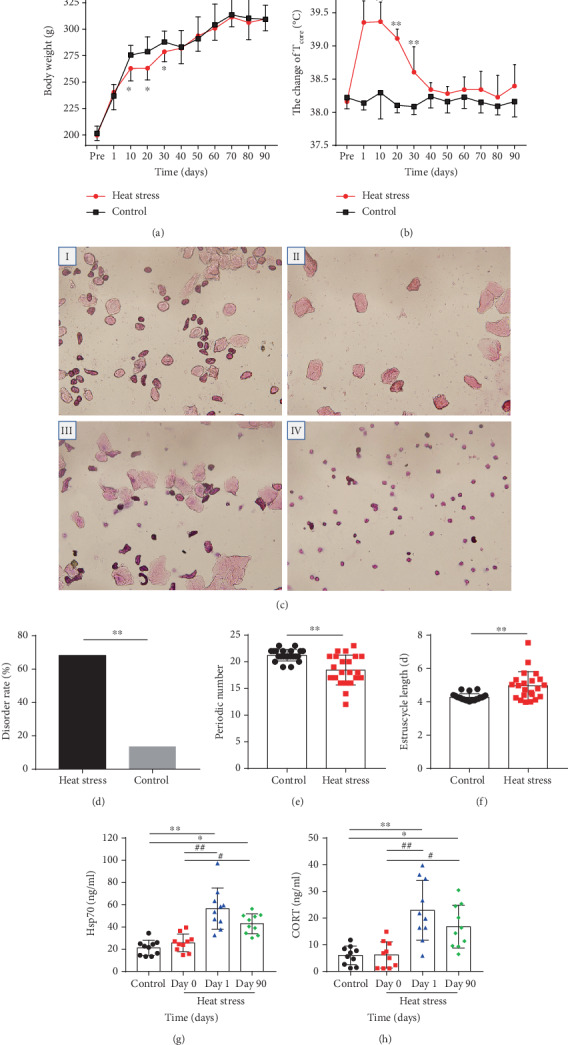
Figure 1.

Estrous cycle disorder model in female animals induced by high temperature. (a) Change in body weight of female rats in heat stress (n = 10). The body weight of the rats was measured every 10 days. (b) Effects of heat exposure on Tcore (n = 10). The Tcore of the two groups of rats was determined in the rectum at 5 cm by an animal rectal thermometer every 10 days. (c) Microphotographs (10 × 40) of cellular characteristics for the identification of the estrus stage. Proestrus smear mainly consisted of nucleated epithelial cells (I); an estrus smear primarily consisted of anucleated cornified cells (II); a metestrus smear consisted of the same proportion among leukocytes anucleated cornified cells, and nucleated epithelial cells (III); and a diestrus smear primarily consisted of leukocytes (IV). (d) Effects of heat exposure on cumulative estrous cycle disorder rate (n = 22). (e) Effects of heat exposure on periodic numbers (n = 22). (f) Effects of heat exposure on estrus cycle duration (n = 22). (g) The content of serum Hsp70 in the heat stress group (n = 10). (h) The content of serum CORT in the heat stress group (n = 10). The protein concentration of serum Hsp70 and CORT was detected by ELISA. The blood samples from the medial canthus of two groups' rats were collected at day 0, day 1, and day 90. Values were presented as mean ± SEM. ∗P < 0.05 and ∗∗P < 0.01vs. the control group, #P < 0.05 and ##P < 0.01vs. the heat stress group (day 0), and △P < 0.05 and △△P < 0.01vs. the heat stress group (day 90).
