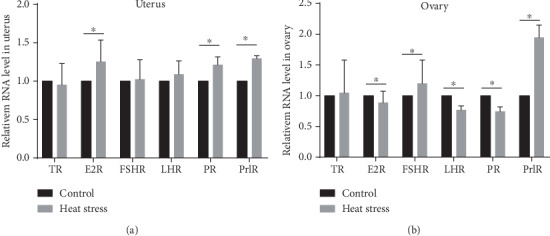
Figure 4.

Expression of TR, ER-α, FSHR, LHR, PR, and PrlR genes in the reproductive organs of the two groups rats (n = 10). (a) Gene expression of sex hormone receptors in the uterus. (b) Gene expression of sex hormone receptors in the ovary. The level was represented as the mean value ± SEM. ∗P < 0.05vs. the control group.
