Figure 4.

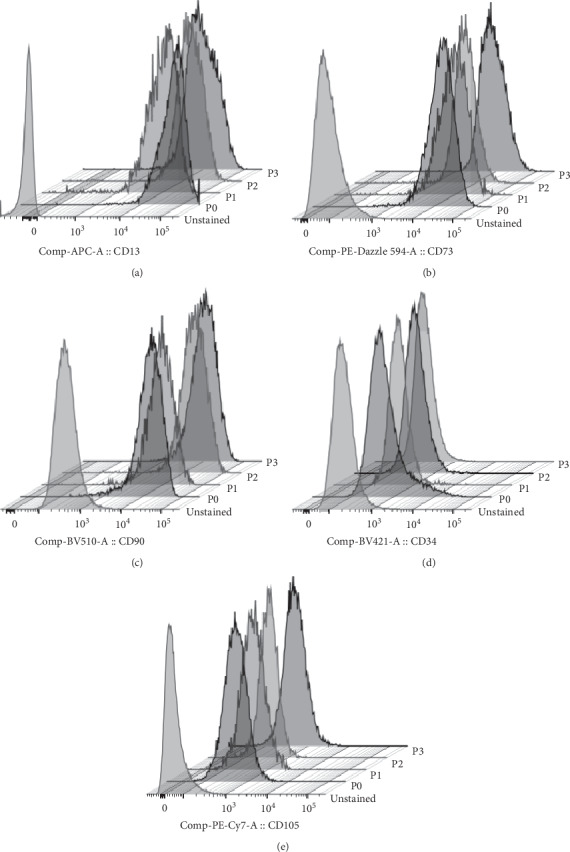
Representative stacked histograms of expanded ADSC at passages 0–3 for phenotypic changes when compared to unstained cells.

Representative stacked histograms of expanded ADSC at passages 0–3 for phenotypic changes when compared to unstained cells.