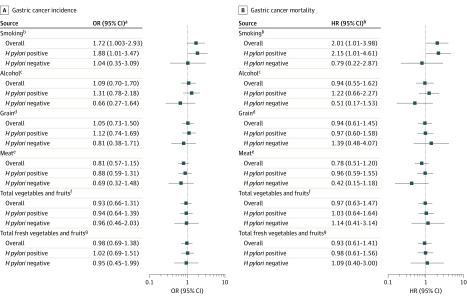
Figure 2. Associations Between Lifestyle Factors and Gastric Cancer Incidence and Mortality.
HR indicates hazard ratio; OR, odds ratio.
aLogistic regression adjusted for baseline histology, age, sex, history of ever using alcohol, history of ever smoking, vitamin supplementation (treatment or placebo), garlic supplementation (treatment or placebo), and H pylori treatment (H pylori treatment, placebo, or no H pylori).
bEver smoking vs never smoking.
cEver using alcohol vs never using alcohol.
dConsuming at least 225 kg/y vs less than 225 kg/y (levels correspond to median distribution of intake between the 2 groups).
eConsuming at least 8 kg/y vs less than 8 kg/y (levels correspond to median distribution of intake between the 2 groups).
fConsuming at least 92 kg/y vs less than 92 kg/y (levels correspond to median distribution of intake between the 2 groups).
gConsuming at least 81 kg/y vs less than 81 kg/y (levels correspond to median distribution of intake between the 2 groups).
hCox regression adjusted for baseline histology, age, sex, history of ever using alcohol, history of ever smoking, vitamin supplementation (treatment or placebo), garlic supplementation (treatment or placebo), and H pylori treatment (H pylori treatment, placebo, or no H pylori).

