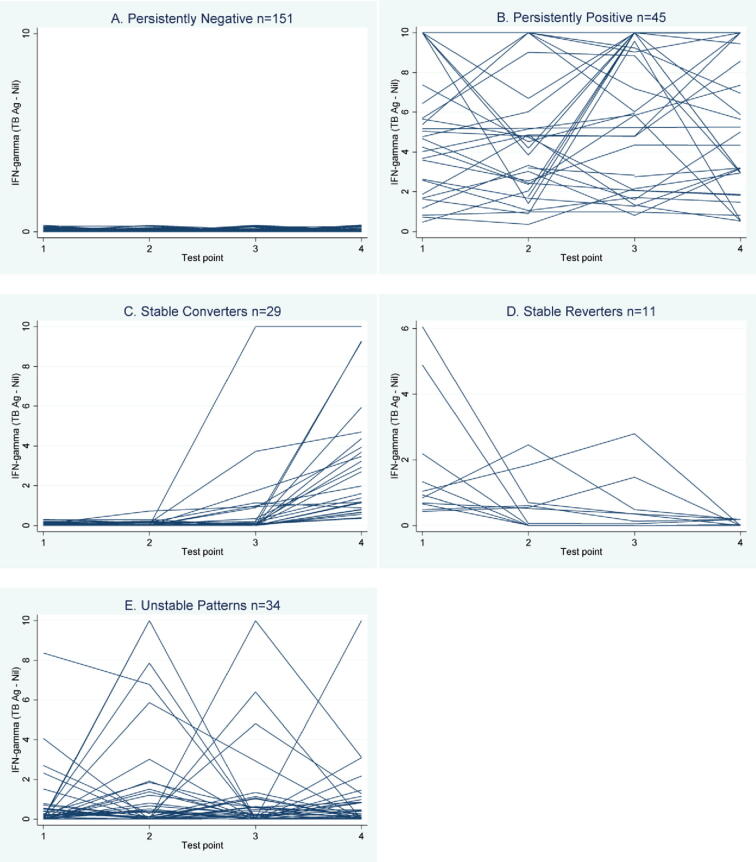
Figure 2.
Trajectory plot of interferon-gamma (TB antigen – nil) over 4 test points, by participant. Trajectory plots of continuous interferon-gamma (TB antigen – nil, IU/ml), within each participant over time. Plots are presented for all students with the same 18 month QFT trajectory together (i.e., A: all students with persistent negative patterns; B: all students with persistent positive patterns, etc.).

