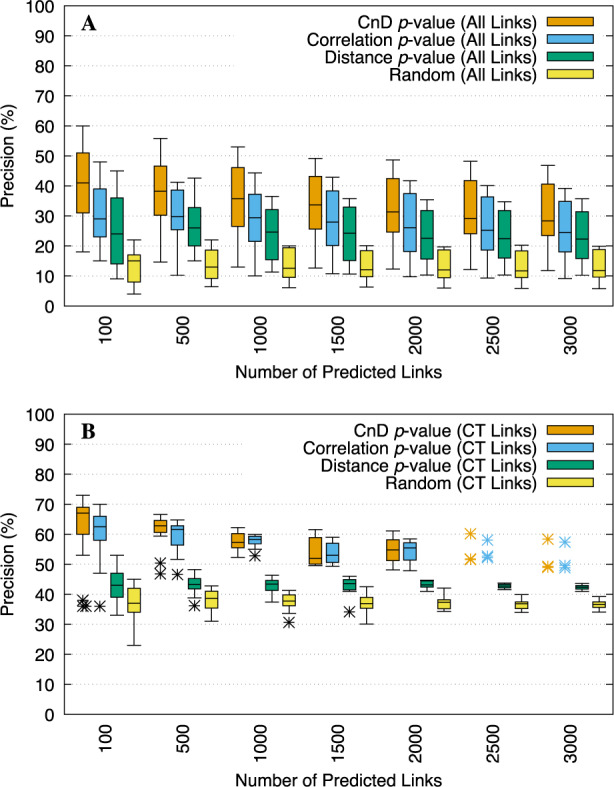
Fig. 2.

Accuracy of T-Gene scores using the ENCODE eight-cell-line panel. Boxplots show the precision of the top links (A) or top CT links (B) predicted by T-Gene using the CnD, Correlation or Distance P-values, averaged over the 23 GM12878 TF ChIP-seq datasets. The accuracy of randomly selected links (A) or CT links (B) is shown for comparison (‘Random’)
