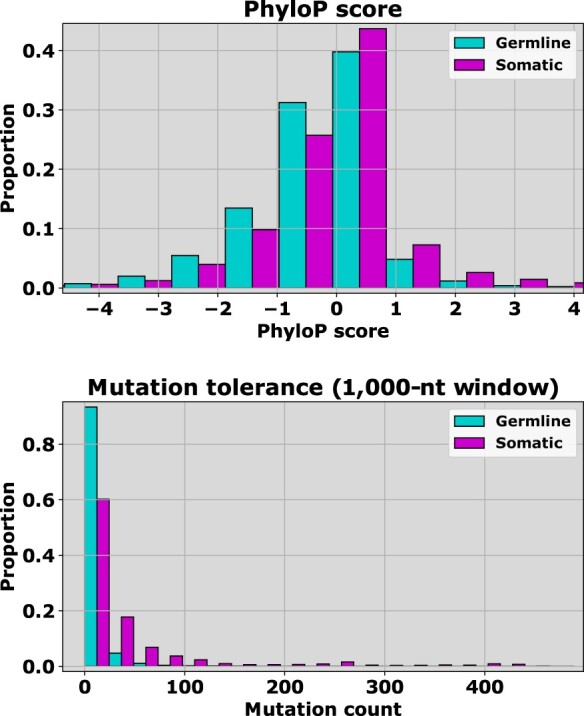
Fig. 2.

Scoring distributions for SNVs in the non-coding datasets show differences between germline (1000 Genomes) and rare somatic (COSMIC, r = 1) examples. The features that discriminate most clearly between germline and somatic variants are those associated with conservation scores (top) and the somatic mutation frequency within a local region (bottom). Conservation scores do not yield the kind of discrimination we see typically when comparing pathogenic or oncogenic mutants with presumed benign variants, however PhyloP scores suggest that putative somatic passenger variants are more closely associated with highly conserved regions (lower scores indicate greater conservation) than benign germline variants (top). This same pattern holds for other conservation scores, but the distinction is less clear (Supplementary Fig. S2). Somatic variants also appear to reside in regions with higher mutation tolerance, as measured by the number of somatic variants found within a region of 1000 positions (bottom). The individual probabilities that the two distributions in each subplot come from the same underlying distribution are upper bounded by , and hence the differences are certainly statistically significant
