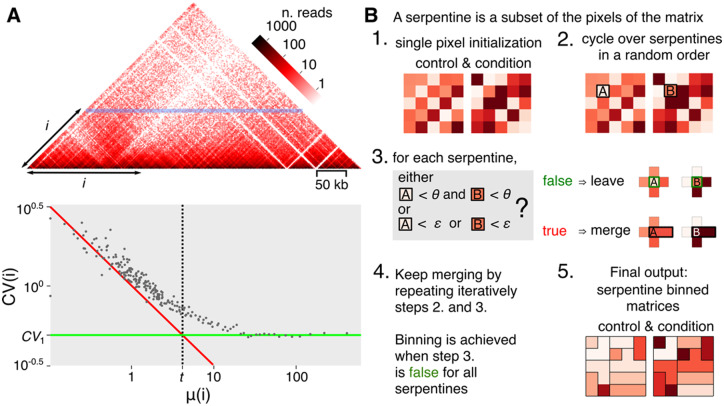
Fig. 1.
Contact matrix and algorithm. (A) Hi-C matrix (S.cerevisiae chromosome V). Since contact matrices are symmetric, only one half is shown. Each pixel of the map corresponds to a pair of coordinates of genomic segments (or bins). The color intensity reflects the frequency of contacts. The horizontal blue line corresponds to one of the diagonals of the contact matrix, with indicating the distance separating the pairs of segments positioned along that diagonal. At high values, i.e. for DNA segments separated by large distances, the matrix becomes sparse (white pixels). The lower panel shows the mean and for all diagonals (i.e. values) of the matrix. The resulting scatter-plot reveals a transition that defines two constants: the constant (green line, for ) and the mean constant (dotted line, intersection of green line and the Poisson distribution represented by the red line). Dots at the left of and over are subject to the effect of sparsity. (B) Algorithm flowchart of serpentine. See main text for detailed description of the workflow. (Color version of this figure is available at Bioinformatics online.)

