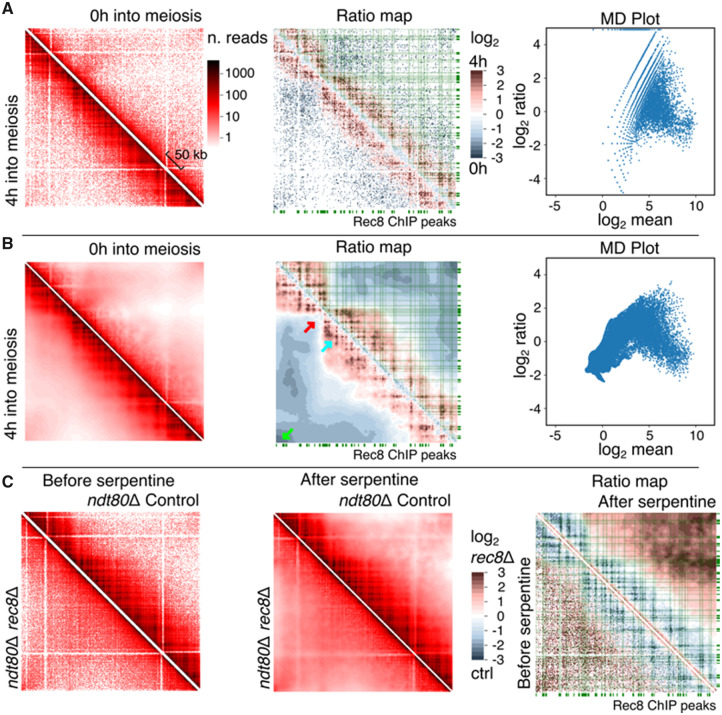
Fig. 3.
Serpentine analysis comparing contact maps generated during meiosis. Time course at 0 and 4 h, before (A) and after (B) serpentine binning, left, right and central panels are the same as in Figure 2. (C) Serpentine analysis comparing the Rec8 cohesin deletion mutant to control, in a population blocked in pachytene through Ndt80 deletion: before binning, after binning and ratio-maps. The green rectangles along the axis of contact maps correspond to the deposition sites of the cohesin meiotic subunit Rec8. The green lines connect these deposition sites to the diagonal. Green arrow: telomere-telomere contacts. Red arrow: centromere position. Cyan arrow, meiotic loop. (Color version of this figure is available at Bioinformatics online.)

