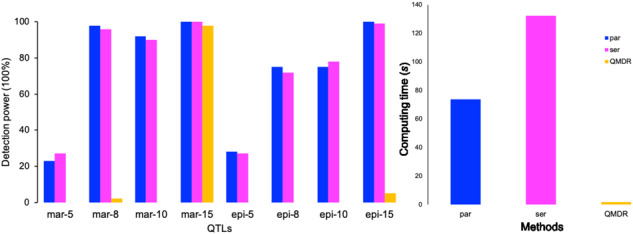
Fig. 3.

The detection power of main and epistasis with application of matrix multiplication and parEBEN, serial EBEN or QMDR. Blue bars show the detection power for QTL with different heritabilities of parEBEN; Magenta bars show the detection power of QTL with different heritabilities of serial EBEN; Yellow bars show the detection power of QTL with different heritabilities; mar-5 means the main effects with heritability of 5% and epi-5 means the epistatic effect with heritability of 5%. (Color version of this figure is available at Bioinformatics online.)
