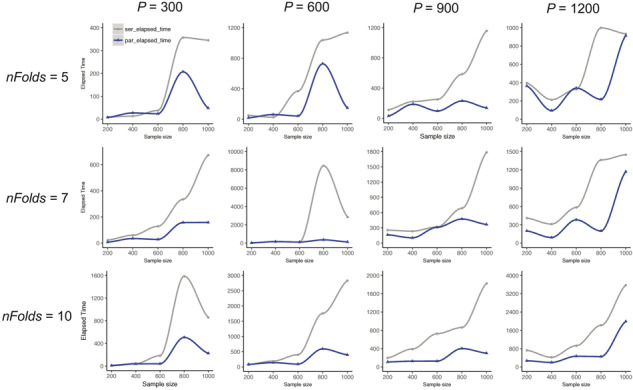
Fig. 4.

The elapsed times (in seconds) between serial EBEN and parEBEN in Monte Carlo simulation experiments. Three fold numbers 5, 7 and 10 are corresponding to each row, and four sample sizes 300, 600, 900 and 1200 are corresponding to each column. Gray lines denote the elapsed time from serial EBEN; Blue lines denote the elapsed time from parEBEN. (Color version of this figure is available at Bioinformatics online.)
